
Five AID systems, side by side
Automated Insulin Delivery Systems
The choice usually gets made at a kitchen table, with a leaflet from clinic on one side and a phone full of half-open tabs on the other. This page is here to make that table a bit quieter. Five systems, laid out the same way, so you can hold them next to each other and see what actually differs.
Ask Grace
Want to ask how these five systems differ on the things you care about, tubing, phone, tank size, or how much algorithm strength each one gives you? Ask Grace.
What an AID system is
Your body needs insulin all the time, and extra insulin when you eat. Those are two different jobs, and it helps to keep them apart in your head.
Basal insulin works quietly all day and night. It is not for food. It balances the glucose your liver releases on its own.
Bolus insulin is for food. You take it when you eat, to cover the carbohydrate in your meal.
On a pump, both jobs are done by the same fast-acting insulin. Day to day there is no separate long-acting injection any more, no Lantus, Levemir or Tresiba; the pump handles the background job and the food job from one insulin, right through the day. The one place long-acting still comes back is the backup plan: if a pump stops, there is no reserve of background insulin in the body, so every pump user keeps pens and a written plan for that. Your team sets it up when you start.
An AID system is a small computer, called an algorithm, that sits inside the pump or in a phone app. It watches your glucose sensor and turns your background insulin up or down by itself, many times a day. That is the part you no longer have to think about.
The part you do still think about is food. Every system here is a hybrid closed loop, which means you still tell it about meals and snacks, ideally about fifteen minutes before you eat. The foundations still matter on every one of them: balanced meals, honest carb counting, and bolusing before the food rather than after it. AID is a substantial layer on top of that work, not a replacement for it.
What tends to change, and by how much
+10 to 15 percentage points of extra time in range, on average.
With a sensor alone, most people spend somewhere around 40 to 60% of the day in the target range (3.9 to 10.0 mmol/L, 70 to 180 mg/dL). On an AID system the large registries sit at roughly 65 to 75%. The usual gain is around 10 to 15 percentage points, and it tends to be larger for people who were starting lowest, where the biggest real-world series saw an average move from about a third of the day in range to about two thirds. These are population averages, not a forecast for you; your team will look at your own data rather than the average.
The other thing people notice, often before they notice the numbers, is the night. Overnight is where the algorithm has the clearest run at the problem, because no one is eating, and it is where most of the gain lands. Parents tend to notice within days. Adults tend to notice within a week.
The thing you are actually choosing between. Where systems have been put head to head, the differences have not been significant: a matched comparison of the 780G against Control-IQ found no meaningful gap (Beato-Vibora 2024), and a study of young people on Omnipod 5 or Control-IQ found the same (Gera 2025). So the question is not which system works better. It is which one fits your life, your sensor, and how much you want the algorithm to ask of you.
Expected time-in-range improvement, by scenario. Listed alphabetically, not by size of benefit.
Words you will see on this page
These come up on every card below. None of them are as complicated as they sound.
What every one of them still asks of you
Whichever you pick, they work the same way underneath, and they ask the same things.
- It turns insulin up when glucose is rising and down when it is dropping, by itself.
- You still count carbs and enter them for meals and snacks, ideally about fifteen minutes before eating.
- You change the pod or cannula every two to three days.
- You wear a sensor all the time, changed every seven to fifteen days depending which one. Sometimes you will still need a finger prick to check it.
- You check for ketones if glucose goes above 14.0 mmol/L (252 mg/dL), or if you are unwell. Below 0.6 mmol/L is normal; 0.6 to 1.5 is the band most sick-day plans treat as needing action; above 1.5 is the band that needs the team.
- On a pump, a high that will not come down with ketones alongside it usually means insulin is not getting in: a kinked cannula, a failed set, a pod that has stopped. That is why sick-day plans on a pump send the next insulin in by pen or syringe rather than through the pump, and involve changing the site. Your team’s written plan says what yours is. If you do not have one in writing, ask for it before you need it.
- You always carry fast-acting carbohydrate to treat or head off a low: glucose tablets, or a small carton of juice.
- You do a few start-up sessions in the first two weeks, a few tweaks in month one, then a check-in every few months.
The five systems, side by side
Every card follows the same layout, so you can compare them straight down the page. Open “tell me more” on any card for the detail underneath.
MiniMed 780G
MiniMed, minimed.com
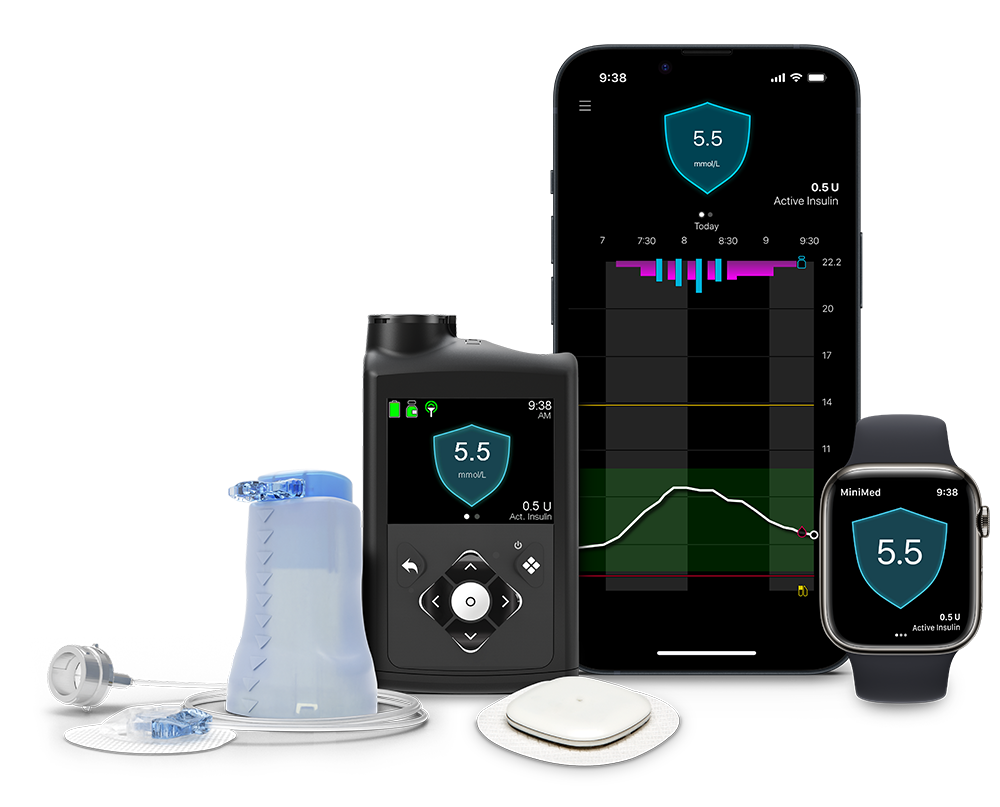
This pump, running software called SmartGuard, does most of the moment-to-moment thinking for you. It has a tube. The 300-unit tank is the biggest here, so it is one to look at if you use a lot of insulin in a day; your team can tell you whether your own dose makes that a real consideration.

The Hulk. Its strength is aimed squarely at highs between meals, correcting in small amounts every five minutes rather than waiting.
Tell me more
How it works. SmartGuard checks your glucose and gives more or less insulin every five minutes, on its own, and it will also give small correction doses without being asked. The setting your team is most likely to adjust on this system is active insulin time; your team can set it, usually somewhere between two and four hours, and the manufacturer’s recommended starting point is two. Shorter means it corrects more strongly; longer means it holds back. Your team can also set the number it aims at, to 5.5, 6.1 or 6.7 mmol/L. 5.5 is the lowest target available on any of these five systems. You still tell it about your food, every time.
The 780G is built around correcting highs. It can add small correction doses every five minutes when your glucose is heading up, and your team can set both how long it counts your insulin as still working and which number it aims at. That target is set by age band, so the adult starting point is not the children’s one.
Good for. Straightforward day-to-day use, once it is set up. The big 300-unit tank. A choice of three sensors, which matters if you already get on with one of them.
Worth knowing. It has a tube, and it stays connected to your body nearly all the time. No study shows this system beating the others on time in range. The differences are about what fits your life, not which one works better.
t:slim X2 with Control-IQ+
Tandem Diabetes Care, makingdiabeteseasier.com
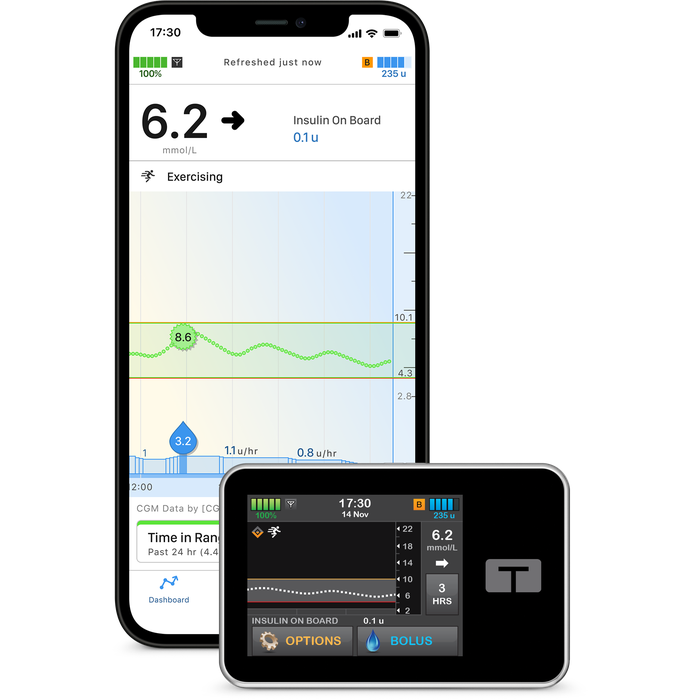
Control-IQ+ is the current version, and it is what every new Tandem pump now comes with. It shows you your insulin on board on the screen, and it can give itself a little extra insulin rather than only turning the background up and down.

Spider-Man. Versatile and flexible to manage any challenge.
Tell me more
How it works. It does two things at once. It moves your background insulin up and down, and it can add a small correction dose by itself if it predicts you will be above 10 mmol/L in half an hour. It works about 30 minutes ahead, acting on where your glucose is heading rather than where it is right now. Its active insulin time is fixed at five hours and cannot be changed, which means the insulin-on-board figure on the screen always rests on the same five-hour assumption. It counts the insulin you have bolused, including the pump’s own automatic corrections; the extra background insulin the algorithm adds is not in that number. You can set different plans for weekends or holidays.
The phone side. The pump has its own touchscreen, so you can bolus on the pump without a phone in your hand. A compatible phone running the Tandem mobile app adds two things: bolusing from the phone, and sending your pump and sensor data up to Tandem Source, Tandem’s own platform, where your team can look at it between appointments.
Control-IQ is the one you can personalise most. With great power comes responsibility, though: it only performs as well as the settings behind it, and the correction factor is the one that moves the needle most, with the basal rates and the carb ratio behind it. Kept up to date with your team, it is genuinely versatile.
Good for. Seeing what the system is doing, and knowing why. The 300-unit tank. A choice of three sensors, including FreeStyle Libre 3 Plus. Being able to reason about insulin on board is particularly useful around exercise.
Worth knowing. It has a tube, and it stays connected nearly all the time. Tandem update the pump’s software from time to time, which is how features arrive without changing the hardware; your team will tell you how updates are done on your pump. No study shows this system beating the others on time in range; the differences are about fit, not performance.
Tandem Mobi
Tandem Diabetes Care, tandemdiabetes.com
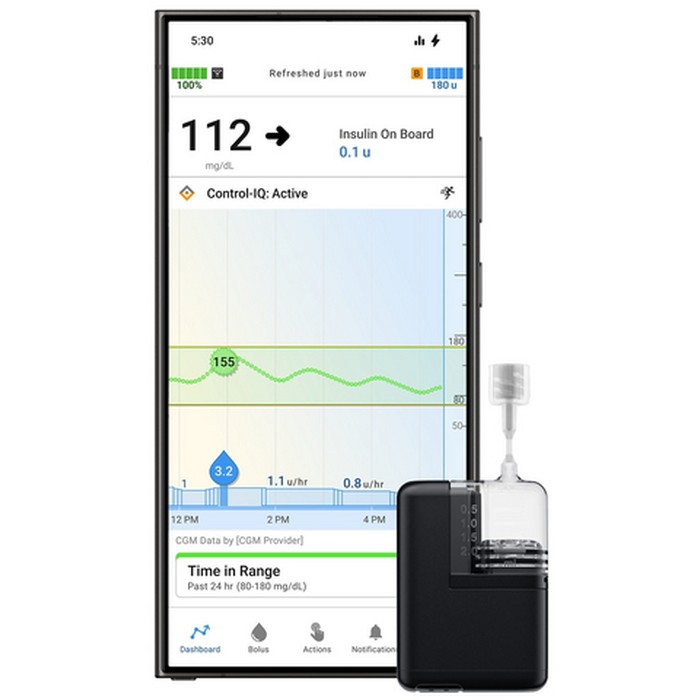
The smallest of the five. It sits stuck onto your body with a very short line to the cannula rather than a long tube, and it runs exactly the same Control-IQ+ software as the t:slim X2.
The same Spider-Man in a smaller suit. Identical thinking, no screen, so the phone app does the talking.
Tell me more
How it works. Mobi is a very small version of the t:slim X2. Same Control-IQ+ software, same behaviour: about 30 minutes of looking ahead, the same fixed five-hour active insulin time, the same small automatic corrections. The difference is the hardware. You wear it on your body rather than carry it, and it charges wirelessly, the way some phones do.
The phone side. This is where Mobi differs from its bigger sibling. The Mobi has no screen, just a single button on the pump for a quick bolus, so in day-to-day use the Tandem mobile app on a compatible phone carries most of the interaction, and it is also how data reaches Tandem Source for your team. Tandem’s design is the same wherever you are; what differs is not the design but what your regulator has approved, and for the Mobi that is not confirmed in the UK. The automation itself does not depend on the phone being with you.
Because the algorithm is identical to the t:slim X2’s, the decision here is about hardware rather than behaviour. It is worn on your body with a short line rather than carried on a long tube, it charges wirelessly, and with no screen the phone app carries nearly all of the day-to-day interaction. The tank is 200 units rather than 300.
Good for. Anyone who wants Control-IQ+ on the smallest possible device, and who would rather not have a long tube running to a pump in a pocket.
Worth knowing. It is not a tubeless pod. There is still a short line from the device to the cannula site, so it is not the same as wearing an Omnipod. The 200-unit tank is smaller than the t:slim X2’s 300, so it may not be the best fit if you use a lot of insulin in a day. It is the newest option here, and Tandem list it for pre-order. What you can actually get depends on where you are and on what your regulator has approved: in the UK, MHRA approval is not confirmed and the Mobi is not on the NHS England HCL chart, so ask your team what your clinic can offer.
Omnipod 5
Insulet, omnipod.com
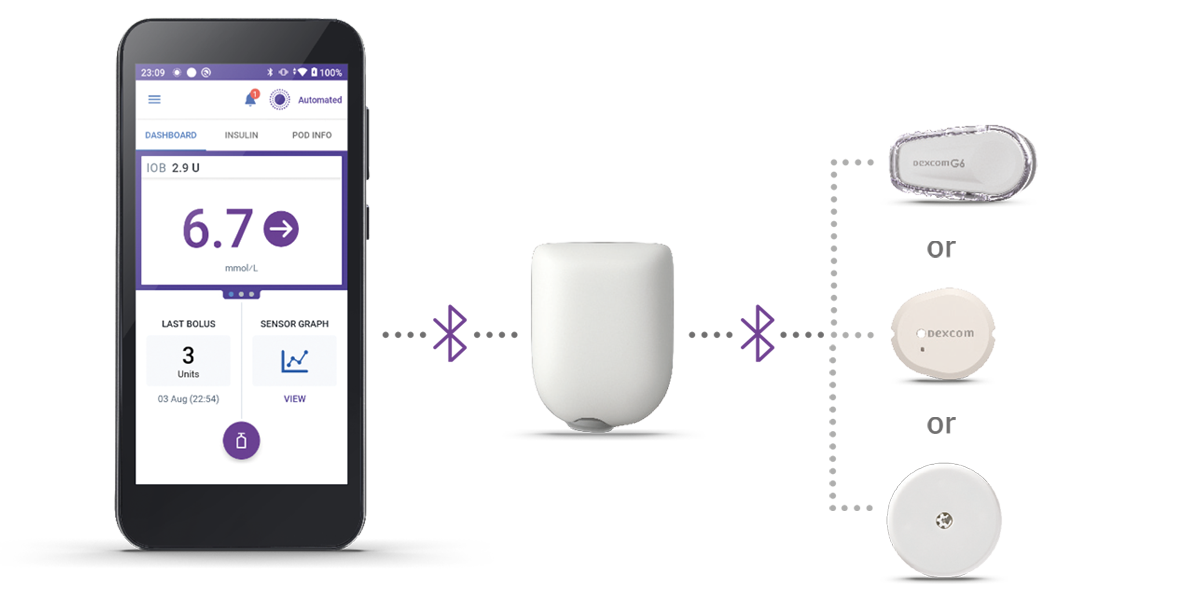
No tube at all, just a small pod stuck straight onto your skin. It keeps working when your phone is in another room, because the algorithm is on the pod rather than in the app.

Iron Man. A sleek shell with the machinery hidden inside, because the algorithm lives in the Pod itself rather than in anything you carry.
Tell me more
How it works. The whole system, the insulin, the algorithm and the cannula, sits inside one pod on your skin. It checks your glucose and adjusts by itself. Your Controller or phone shows you the numbers and is how you bolus for food. It works differently from the two Tandem pumps: rather than giving separate correction doses of its own, it adjusts the background insulin in small amounts every five minutes, and it can push that up to about four times your usual background rate when it needs to. It looks about an hour ahead. Your team sets the active insulin time, and can set the target to one of five settings between 6.1 and 8.3 mmol/L.
What you hold in your hand. Omnipod 5 is controlled from the Omnipod 5 Controller, the handset that comes with the system. There is also an Omnipod 5 phone app, but it is not supported everywhere, so which of the two you get depends on where you are and on what your regulator has approved. Your team or Insulet will confirm the current position.
The sensor changes the answer. Which sensor you pair with decides whether you also need a phone. With the FreeStyle Libre 2 Plus, the Pod and the sensor are both handled from the Controller, so no phone is involved at all. With a Dexcom G6 or G7, you also need a compatible smartphone running the Dexcom app as part of the system; the Dexcom’s own receiver will not do the job here. Worth asking about early, because it is easy to miss until the sensor decision is already made (Insulet product information, read 28 July 2026).
What the Pod does on its own. The Pod runs the automation itself, so it keeps adjusting your insulin every few minutes without needing a constant connection to the Controller or a phone. What you lose when they are not with you is the ability to bolus and to see what is happening, not the automation. Your team can talk you through what your own set-up needs nearby.
Like Iron Man, it has a sleek exterior with all the magic happening underneath. SmartAdjust keeps running inside the Pod even when the Controller or phone are not with you.
Good for. No tubing at all, and it is waterproof. Many people find it the least fiddly of the five day to day, though how simple something feels depends a good deal on the person wearing it. It keeps running if the phone is nowhere near.
Worth knowing. The pod sits proud of the skin and can feel bulky on a small body, so it is worth seeing one before you decide. The 200-unit tank may not be the best fit for a high daily dose.
CamAPS FX (on Ypsopump)
CamDiab, on Ypsomed hardware, camdiab.com and mylife-diabetescare.com
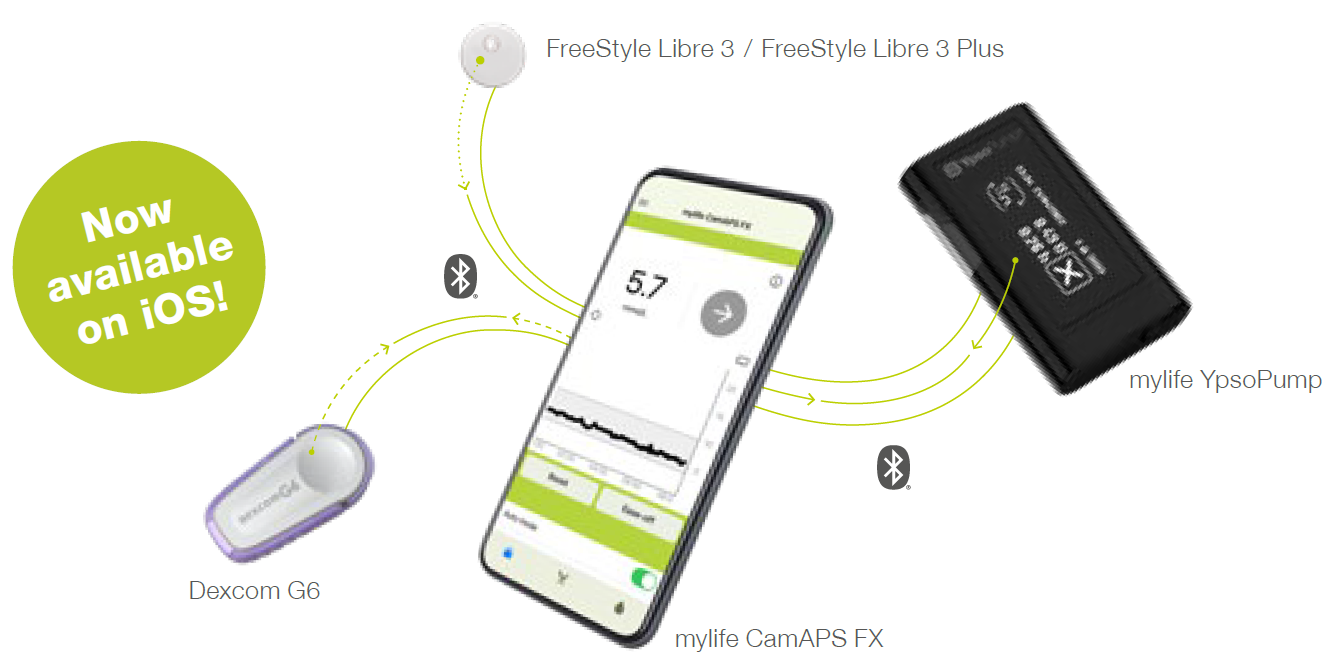
Licensed from 1 year, the youngest starting age of any system here and the only one licensed below 2. It comes out of the longest continuously running research programme in this field, and much of the published work in very young children and in pregnancy has been done on it, though other systems now have trials in both groups too; that tells you where the studies happened, not that it will work better for your child. It needs a phone nearby at all times to run the algorithm.

Batman. No single superpower, a lot of preparation, and the widest set of tools of the five for shaping what it does.
Tell me more
How it works. The clever part, the algorithm, lives in a phone app rather than in the pump. It works out your insulin needs from your weight and your glucose pattern, and adjusts the pump every eight to twelve minutes. You can set your own target with your team; the usual working range is 4.4 to 7.0 mmol/L, and the app allows higher. There are Boost and Ease-Off modes for days that are not like the others.
The CamAPS FX algorithm is clever and has plenty of tricks up its sleeve. The personal target has real depth and flexibility, and on top of that sit two separate sets of tools: Boost and Ease-off, which turn the algorithm up or down for a while, and the Add Meal options, which tell it what you have just eaten or taken for a low.
Good for. Being usable from one year old. Being able to tune your own target. There is a pre-filled insulin cartridge, so no drawing up.
Worth knowing. It needs a compatible phone nearby at all times; if the phone is flat or left behind, the automation stops. It has a tube. If your insulin dose is high, the DANA-i pump option holds 300 units against the standard Ypsopump’s 160, which is worth asking your team about.
What holds in children and young people
For a parent the moment that lands hardest is rarely the one in the textbook. It is the half-second pause before a feed at 4am, the school-nurse phone call at 1:15pm, the teenager who leaves the pump in a drawer for three days because they want to feel normal. From the conversations I have in clinic at Birmingham Women’s and Children’s, what families describe is the same pattern with different specifics. Most of the work happens at home, between visits, by the people who never get called diabetes specialists.
The trials point the same way. KidsAP02 (Ware 2022, NEJM) added around two extra hours a day in target for children aged one to seven, without more time spent low. The preschool Omnipod 5 work (Sherr 2022) found the same shape of result in two to five year olds. Two trials, one direction.
The honest counterweight sits in the registry data: closed loop cut hypoglycaemic coma, but the overall rate of DKA was higher than in young people on a pump without automation, and most of that sat with young people whose HbA1c was already higher. The likely reason is insulin quietly not getting in, a kinked cannula or a device fault that goes unnoticed because the algorithm is doing more of the day-to-day work. The answer to that is not less AID. It is sick-day rules that actually run when a child is unwell, ketone checks that happen, and a low threshold for changing the site.
Which system, and which settings, for any individual child is a conversation with your paediatric diabetes team. Ask early, ask in writing if you need to, and ask again if the first answer is “not yet”.
Does ultra-rapid insulin add much on AID?
Ultra-rapid formulations (Lyumjev and Fiasp) absorb faster and clear sooner than standard rapid-acting analogues. Rakab 2025 (Frontiers in Endocrinology, systematic review and meta-analysis of 12 RCTs across six AID systems) found ultra-rapid insulin produced less than 1 percentage point of TIR improvement compared with standard insulin, not statistically significant. The AID algorithm compensates for insulin speed so effectively that the formulation barely changes overall TIR. The benefit, where it is real, sits in reduced glycaemic variability and improved exercise safety margins, not in the headline TIR number. Discuss with your diabetes care team whether either of those is a priority for you.
AID Systems Knowledge Check
Try the assessment on this page any time, before you explore the pump guides below or once you have worked through them. It is a quick way to see where the gaps are in the AID essentials, and 9 out of 10 earns your certificate.
Read more on GNL
How this comparison was put together
The facts on each card come from the manufacturers’ own published information and from the GNL guide for each system. This page also draws on the wider GNL AID Optimiser, an internal educational framework; it is not a manufacturer endorsement, and it is not validated against any manufacturer’s own simulator. It is educational, not clinical advice, and does not give you a dose or a setting. Any actual change is a conversation with your diabetes care team.
For more detail on how we put this comparison together, email john@theglucoseneverlies.com.