
The IOB Guide for T1D, Part 4
The Future of Calculating Insulin On Board
Imagine your pump screen showed two numbers. One the algorithm uses to decide whether to give you a correction. One that tells you, honestly, how much insulin is still circulating. Same biology, two jobs, two numbers.
Ask Grace
Curious where insulin on board calculation is heading next? Ask Grace.
The structural design conflict
Current IOB is being asked to do two different jobs at the same time: represent physiological insulin exposure, and regulate correction behaviour. When one number is expected to do both, trade-offs become unavoidable.
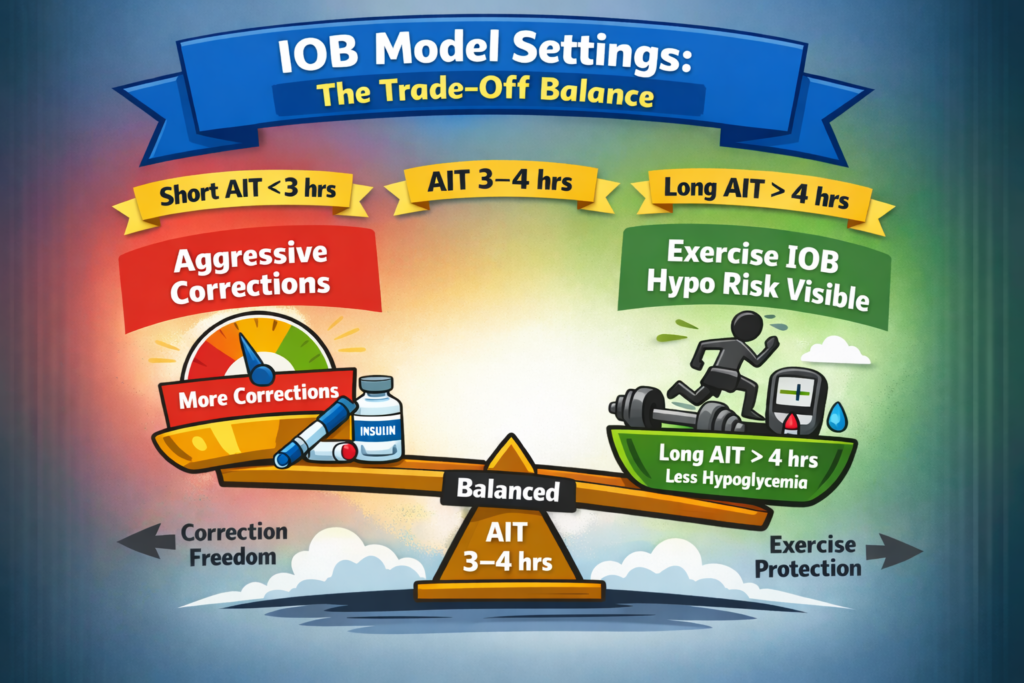
The real question is not whether IOB matters. It clearly does. The question is whether one number can safely control correction behaviour and represent physiological insulin exposure at the same time. The answer, structurally, is that it cannot do both perfectly.
Two jobs, two numbers. One number tells the algorithm whether to allow a correction. A second number tells you, honestly, how much insulin is still circulating. Same biology, two questions, two answers.
There are two options for resolving this. One is pragmatic and evolutionary. The other is more ambitious.
Option 1: Keep the correction model and add physiological exposure as a separate entity
The existing bolus calculator architecture remains unchanged. Active Insulin Time (AIT or DIA) can be reframed for what it already behaves like in practice: a correction strength dial.
Shorter AIT (2-3 hours)
- Less IOB deducted sooner
- Corrections allowed earlier
- Higher algorithm strength
Longer AIT (4-6 hours)
- More IOB deducted for longer
- Corrections restricted
- More conservative behaviour
This preserves the current evidence base, regulatory familiarity, clinical understanding, and existing device behaviour. Alongside this behavioural layer, a second model runs in parallel: a physiological insulin exposure model.
The physiological insulin exposure model (U/kg-based)
This model estimates how much insulin effect may still be circulating in the body. Instead of using a fixed decay assumption, exposure is estimated using recent insulin doses, body weight, units per kilogram (U/kg), and dose-dependent insulin action profiles as discussed in Part 1.
The aim is not perfect prediction. Crucially, this type of model:
- would not block corrections
- would not alter the bolus calculator
- would inform activity and exercise hypoglycaemia risk
The evidence: insulin exposure and exercise hypoglycaemia risk
Large real-world datasets from T1DEXI consistently show that insulin on board at the start of exercise is one of the strongest predictors of hypoglycaemia risk.
| IOB at the start of exercise | Events (%) | Hypoglycaemia risk |
|---|---|---|
| <1 U | 3,874 (44%) | 6% |
| 1-<2 U | 1,788 (20%) | 9% |
| 2-<3 U | 1,191 (13%) | 10% |
| ≥3 U | 1,974 (22%) | 12% |
Even with current modelling limitations, a clear dose-response relationship is visible: as insulin exposure rises, hypoglycaemia risk increases.
However, the insulin exposure in these analyses was calculated using a 4-hour linear decay model based on absolute units, not units per kilogram. This creates two major problems. Body weight is ignored, meaning the same number of units represents very different insulin exposure between individuals. And linear decay underestimates physiological insulin action, particularly the rising effect during the first 60 to 90 minutes and the longer tail of larger boluses.
As a result, the true relationship between insulin exposure and exercise hypoglycaemia risk is almost certainly underestimated. Importantly, even with these limitations the signal is already clearly visible in the data.
In the GlucoseGo and GlucoseLo analyses we used units per kilogram instead of absolute units, which improved the IOB model. The simplified 4-hour linear decay still massively underestimated true insulin exposure. The existing datasets are extremely valuable; the way insulin exposure is currently represented is likely diluting their true impact. With U/kg, time-stamped boluses, physiologically realistic action curves, and exposure windows up to 8 hours, the dose-response relationship between circulating insulin and hypo risk would likely be substantially stronger.
Why a physiological IOB model could be implemented safely
A key advantage of the physiological insulin exposure model proposed in this guide is that it can inform risk without interfering with insulin delivery systems. If implemented within diabetes technology platforms or research tools, its role would be informational rather than prescriptive.
- It would not prevent or restrict user-initiated correction boluses.
- Existing insulin delivery systems would continue to function exactly as they currently do.
- Users and clinicians would retain full control over insulin dosing decisions.
- The model simply estimates circulating insulin exposure, allowing users to understand the potential risk environment for exercise or activity.
The dual role of insulin exposure: risk and utility
Insulin on board has two complementary faces when activity is involved:
- Risk: unintended glucose reduction leading to hypoglycaemia
- Utility: intentional glucose reduction using activity
In practical terms, higher insulin exposure increases the likelihood of glucose falling. That same exposure increases the effectiveness of activity in lowering glucose. Rather than treating insulin on board purely as a constraint, it can also be used to estimate how activity will influence glucose.
Translating this into behaviour
The GlucoseLo analyses of the T1DEXI datasets show a consistent pattern. In the presence of circulating insulin, short periods of light-to-moderate activity produce a predictable reduction in glucose. Across conditions, a central tendency emerges: approximately 2.0 mmol/L (36 to 40 mg/dL) reduction over approximately 20 minutes of activity when glucose is above target and insulin exposure is present.
This can be expressed as a simple behavioural rule: 20 minutes of activity lowers glucose by approximately 2 mmol/L (approximately 40 mg/dL). This is not a fixed physiological constant. The magnitude of reduction varies depending on insulin exposure (U/kg), starting glucose, and rate of change.
Option 2: Redesign the architecture
This approach is structurally cleaner. Instead of pooling all insulin into a single IOB bucket, separate insulin according to intent.
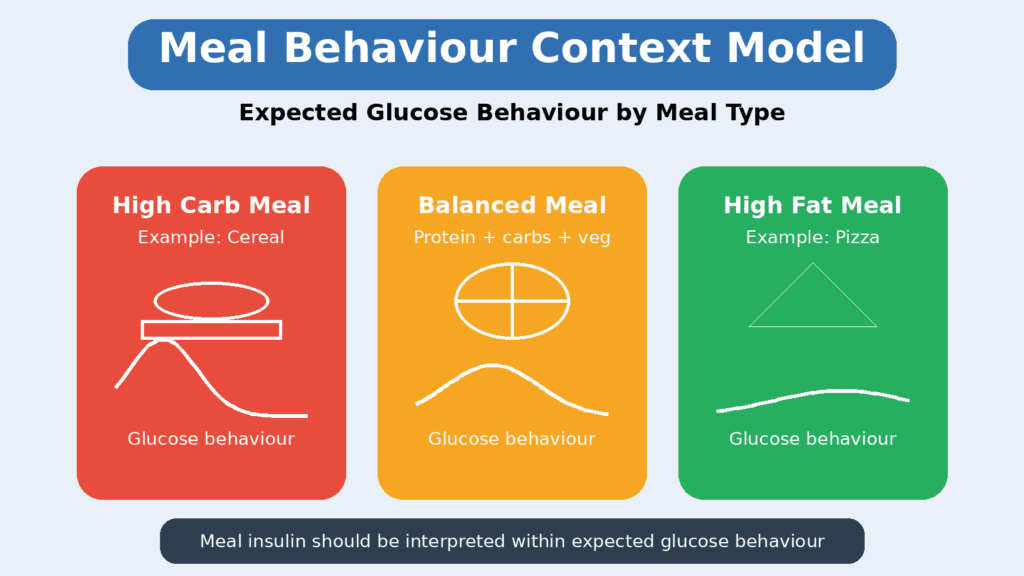
Step 1: Model expected glucose behaviour at meals
At meal entry the system would estimate the expected glucose rise based on carbohydrate type, meal composition, pre-bolus timing, and post-meal activity. This creates a simple glucose behaviour profile rather than a precise prediction. Meal insulin would then be handled within that model rather than automatically restricting corrections.
Step 2: Track correction insulin separately
Correction insulin would be tracked independently using the same U/kg-weighted exposure model, incorporating dose intensity (U/kg), dose-dependent duration, and curvilinear decay profiles. This governs stacking and correction behaviour without meal insulin artificially limiting future corrections.
Step 3: Display total physiological exposure
Total insulin exposure, including both meal and correction insulin, should ideally be modelled internally and then displayed in a clear, intuitive way. For most users, a graded risk scale would be far more practical than a raw U/kg figure. A simple RAG-style exposure indicator (low, moderate, high insulin exposure) allows people to quickly understand their current insulin load and the potential implications for activity or exercise.
This approach is illustrated in the GNL Carbs for 30 Minutes Exercise, where insulin exposure is translated into an easy-to-interpret visual scale. The key distinction becomes simple: correction insulin influences correction behaviour; total physiological exposure informs hypoglycaemia risk. This removes the structural conflict present in current systems.
References
Key papers grouped by theme. Tap to expand. If a paper that should be here is missing, email john@theglucoseneverlies.com.
Synthetic insulin action and pharmacokinetics
Underpin the discussion in Part 1 of how rapid-acting insulin behaves biologically, including the dose-dependent extension of the insulin tail.
- Hirsch et al. (2020), Endocrine Reviews, 41(5), 733-778.
- Donnor & Sarker (2023), NCBI Bookshelf.
- Slattery et al. (2018), Diabetes Care.
Insulin on Board and the concept of net IOB
Essential reading for anyone who wants to understand the structural tension in current IOB models. Referenced directly in Part 2.
- Riddell et al. (2024), The netIOB paper.
Activity, exercise, and insulin on board
Scientific foundation for the exercise-related content in this guide, and for the physiological IOB modelling used in the GNL Explorer tools.
- Bergford et al. (2023), T1DEXI dataset analysis examining IOB at the start of exercise as a predictor of hypoglycaemia risk.
- Pemberton et al. (2023), GlucoseLo: T1DEXI dataset analysis examining activity-related glucose-lowering in Type 1 diabetes.
- GlucoseGo (2026), T1DEXI dataset analysis examining exercise-related glucose outcomes with units-per-kilogram IOB modelling.
Ultra-rapid insulin pharmacokinetics and AID (Pack 4, April 2026)
Informs GNL guidance on ultra-rapid insulin in AID systems, and the 15% exercise IOB uplift applied to the GNL exercise explorers.
- Leohr et al. (2021). Pooled PK/PD analysis of URLi (Lyumjev) vs Humalog across 190 participants: 5 min faster onset, 8x greater early exposure, 35% less late action beyond 4 hours.
- Leohr et al. (2026). Lyumjev exercise PK comparison (Diabetes Care). Free insulin lispro rises in the first 15 minutes of exercise; Lyumjev attenuates glucose drop during activity. Evidence basis for the 15% IOB exercise uplift.
- Rakab et al. (2025). Systematic review and meta-analysis of 12 RCTs: ultra-rapid insulin in AID produces less than 1 percentage point TIR improvement (not significant); glycaemic variability significantly reduced (CV -0.78%, p=0.02).
- Moser, Zaharieva, Pemberton, Riddell et al. (2025). EASD/ISPAD position statement on AID and exercise. System-by-system IOB management guidance for physical activity.
- Bassi et al. (2025). 780G AIT 3h to 2h transition (n=91): +3pp TIR, +3.7pp tight-range, no increase in hypoglycaemia. Key safety evidence for closing the IOB configuration gap.
Part 4 of 4
The Future of Calculating Insulin On Board
Test your knowledge
You have finished the guide. Score 9 out of 10 or more for a certificate.
Ten questions, drawn at random, on the hub page.