
Part 1, The Insulin On Board Guide for T1D
The Insulin On Board to Physiology Mismatch
The first time I caught myself stacking after a Saturday morning ride, my pump showed 0.0 IOB. I had given the breakfast bolus four hours earlier. The screen said I was clear; the body underneath said otherwise. That was the moment I learned the number on the screen and the insulin still circulating are not the same thing.
Ask Grace
Want to explore the gap between the insulin your device shows and the insulin still working? Ask Grace.
How rapid-acting insulin actually behaves
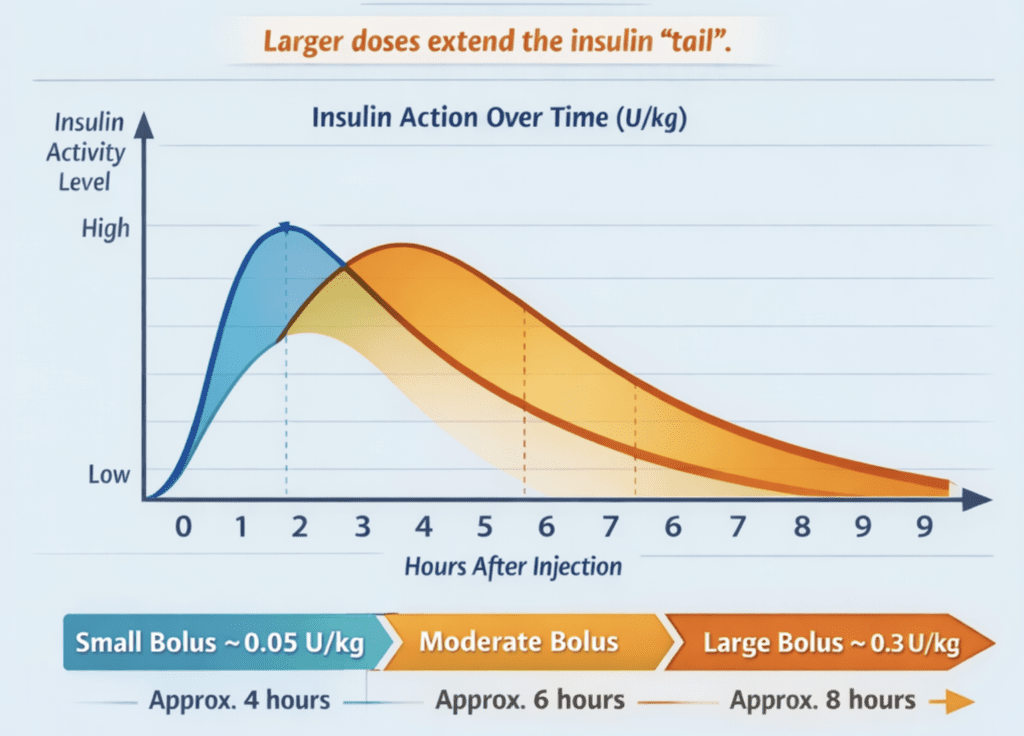
Rapid-acting insulin analogues (aspart, lispro, glulisine, faster aspart, ultra-rapid lispro) do not have a single fixed duration. In broad terms, they begin working within approximately 10 to 20 minutes, often peak around 60 to 120 minutes, and continue exerting biological effect for approximately 4 to 8 hours.
But here is the point most IOB explanations miss. A small bolus behaves differently from a large bolus. The tail stretches as the dose increases. This matters clinically because the boluses that create the most problems (post-meal highs, exercise hypos, correction stacking) are often the larger ones.
One of the clearest ways to think about insulin dose size is units per kilogram (U/kg), which normalises dose relative to body weight and better reflects the physiological exposure created by a bolus.
Dose and duration: what the numbers look like in practice
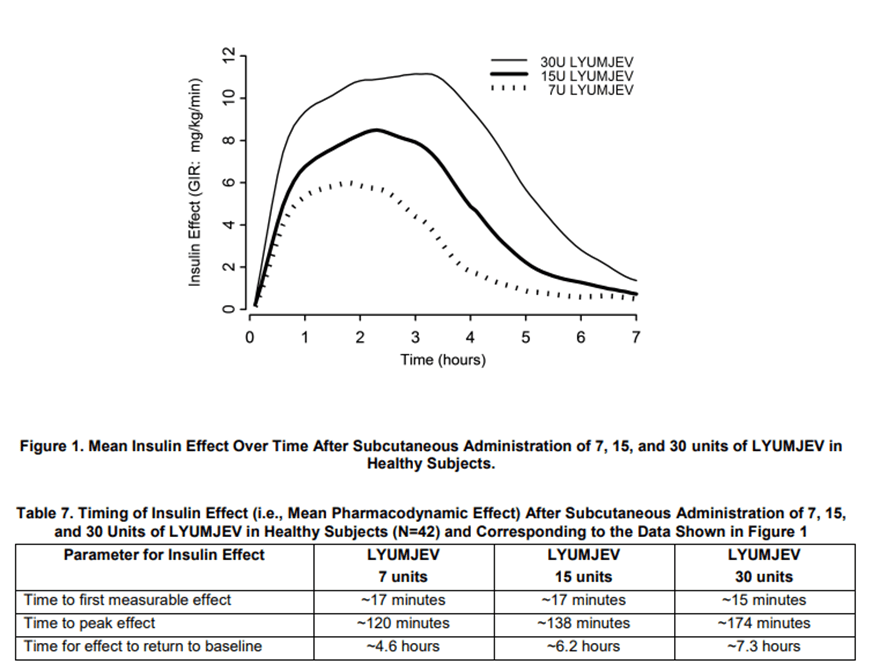
You might assume this does not apply to the newer ultra-rapid insulins such as Lyumjev. However, the prescribing information itself shows otherwise (thanks to Joseph Henske, Professor of Medicine, University of Arkansas, for highlighting this). Pharmacodynamic studies of ultra-rapid lispro demonstrate faster early insulin exposure, but still show a prolonged tail of biological activity, particularly at larger doses. Faster onset does not eliminate the dose-dependent extension of insulin exposure.
The table below shows how the same rapid-acting insulin dose expressed as units per kilogram (U/kg) translates into actual units across different body weights, alongside a conceptual estimate of how long meaningful biological activity may persist. These durations are rough estimates, not fixed pharmacokinetic limits; real insulin action varies between individuals and is influenced by injection site, insulin sensitivity, activity, and stacking. As insulin dose per kilogram increases, both peak timing and the duration of the insulin tail tend to extend.
| Dose per kg | Peak action | Approx. duration |
|---|---|---|
| 0.05 U/kg (small bolus) | ~1 hour | ~4 hours |
| 0.1 U/kg (typical meal) | ~1.5 hours | ~6 hours |
| 0.2 U/kg (large meal) | ~2 hours | ~7 hours |
| 0.3 U/kg (very large) | ~2.5 hours | ~8 hours |
Multiply U/kg by your body weight in kg to get the actual unit dose. The peak/tail relationship is what matters; weight is just the multiplier.
Peak action is not disappearance
A common mental model is: “insulin does its main work after 2 hours.” Peak action does not represent the end of insulin activity. Reduced effect does not mean no effect.
This matters because a lot of T1D decision-making happens precisely in the window where insulin is fading but still meaningful:
- the 2 to 4 hour window after a meal
- the “I’m still high, so I’ll correct again” window
- the “I’ve got time for a quick workout” window
If you treat this window as insulin-free because a display says 0.0, you will repeatedly be surprised by outcomes that are actually predictable once you understand exposure.
Circulating insulin is what drives tissue effects
Physiologically, what matters is insulin exposure to tissues (muscle, fat, liver), which is driven by absorption into circulation and clearance over time. That is why two people can take the same dose and experience different outcomes:
- absorption variability (site, temperature, lipohypertrophy)
- clearance differences (especially the kidneys)
- changes in sensitivity (sleep, stress, hormones, recent activity)
The key distinction. Device IOB is a mathematical estimate. Your physiology is a dynamic biological system. These are not the same thing.
Portal vs peripheral: the gradient is reversed in T1D
In people without diabetes, insulin is secreted into the portal vein and first passes through the liver. The liver sees high insulin concentrations; peripheral tissues (muscle and fat) are exposed to lower concentrations.
In T1D, insulin is delivered into subcutaneous tissue and enters the peripheral circulation first. That reverses the natural gradient.
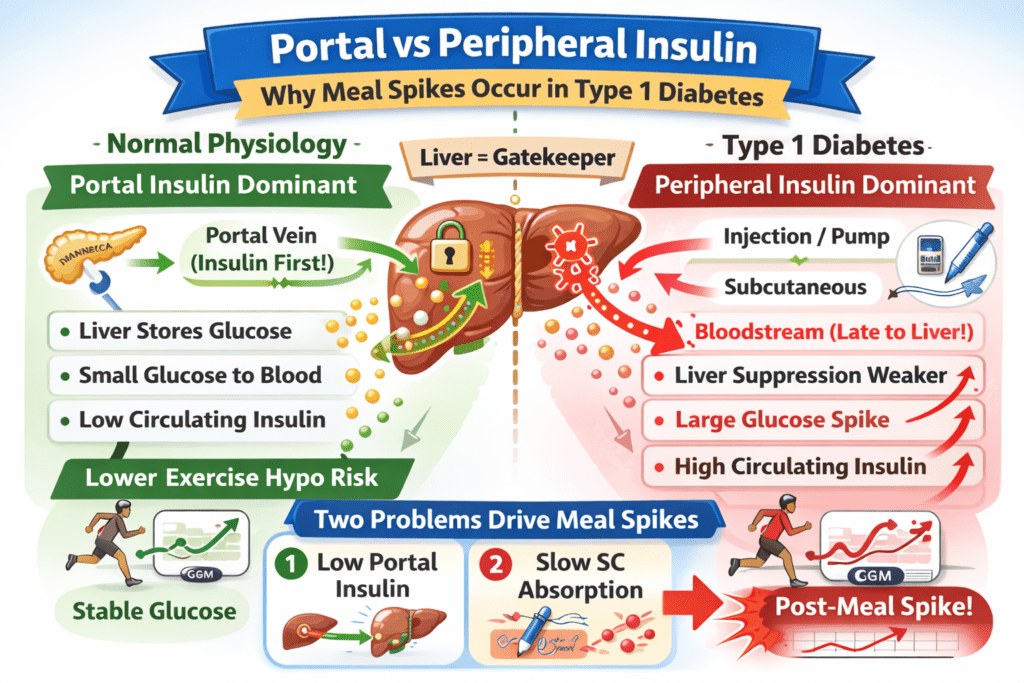
The image above shows the structural reversal. Simply put:
- The liver is under-insulinised, so glucose output is not suppressed, especially post-meal and during stress.
- Muscle and fat are over-insulinised, and when combined with activity, insulin exposure can feel far stronger than expected, even 3 to 4 hours after insulin was administered.
This reversal of insulin exposure between the portal vein and peripheral tissues sits at the heart of the IOB problem. In T1D, insulin is delivered in the opposite direction to how human physiology was designed to use it. This physiological reality is precisely why exercise responses in Type 1 diabetes depend so strongly on the insulin exposure present at the start of activity.
Exercise supercharges insulin exposure
Exercise is often taught as if it simply uses glucose. In T1D, it is more accurate to think of exercise as a multiplier on insulin effects. During physical activity, several things happen at once:
- Muscle blood flow increases, delivering insulin and glucose to working tissue faster.
- GLUT4 transporters increase at the muscle surface (insulin-dependent and insulin-independent pathways).
- Insulin sensitivity rises, sometimes sharply.
- Insulin clearance by the kidneys is reduced, making more insulin available to muscle cells, so insulin effectively becomes stronger.
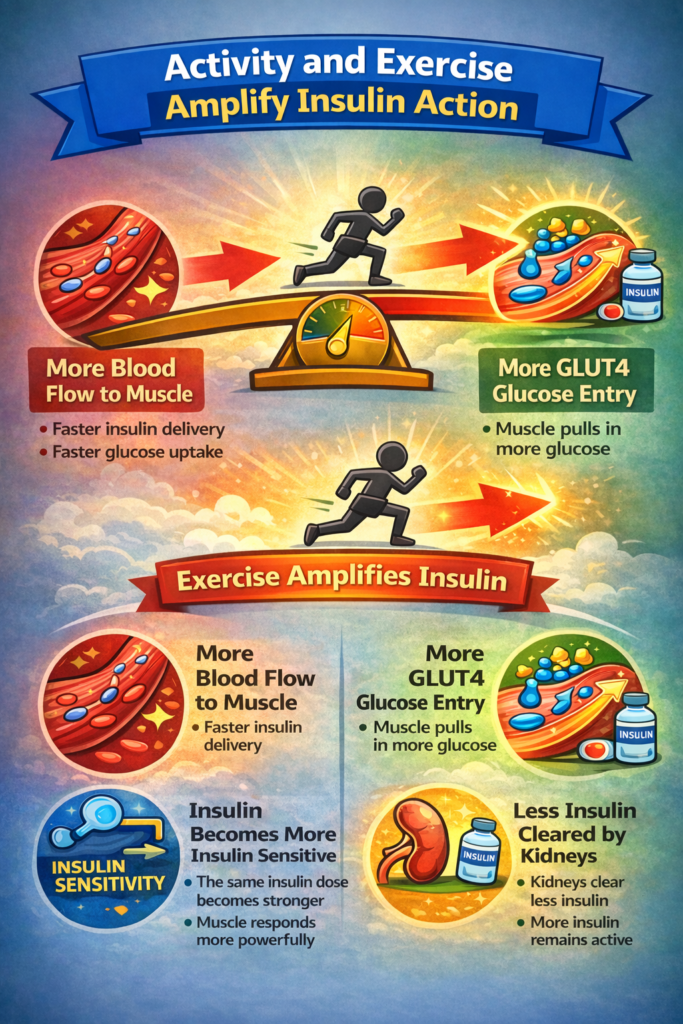
This is where the difference between displayed IOB and physiological insulin exposure becomes critically important. A device may display little or no IOB while circulating insulin remains sufficient to amplify exercise-driven glucose uptake.
This is why two exercise sessions that look identical on paper can behave completely differently:
- Morning fasted activity with no bolus insulin often leads to glucose drifting up.
- The same activity in the afternoon 2 to 4 hours after a bolus can drop glucose fast.
The difference is not the exercise itself. The key variable is the insulin exposure entering the session, shaped by the cumulative bolus and correction doses earlier in the day. This is also why substantial bolus reductions of 25 to 75% are typically required when exercising within two hours of a meal bolus, because the insulin exposure is still near peak.
Four common IOB situations in daily life
Almost everyone living with Type 1 diabetes has experienced at least one of these. At the time, they feel random or unpredictable. Each is actually a different face of the same gap between what the device shows and what your body is doing.
Example 1: “0.0 IOB” and still crashing during exercise
Your AIT is set to 2 hours. Two hours ago, you delivered 10 units for a meal. Glucose is 11.1 mmol/L (200 mg/dL), steady. Pump shows 0.0 IOB. You exercise for 30 minutes; no carbohydrate, why would you. Within 15 minutes, glucose falls fast and you are treating a hypo.
The conclusion many people draw is that exercise is unpredictable. The physiology was predictable. The display was substantially under-representing the insulin still circulating. Exercise simply amplified its effect.
Example 2: High IOB blocks a correction
Your AIT is set at 5 hours. You took 10 units for 100 g carbohydrate. Two hours later glucose is 13.9 mmol/L (250 mg/dL). Your CF is 1 unit per 2.0 mmol/L. You calculate 4 units; the device says you still have 4.4 units IOB and offers no correction. You know you are still rising. So you override, ghost-carb, or pen.
You may have a stronger word for that.
Most of that 4.4 units is still covering carbohydrate digestion. The IOB model does not separate meal insulin from correction insulin, so it blocks a correction your body genuinely needs. Two jobs in conflict, one number trying to do both.
Example 3: Short AIT and repeated corrections
Your AIT is set to 2 hours. Two hours ago you took 10 units for a meal plus a 4-unit correction. Two hours after that, glucose is 12.5 mmol/L (220 mg/dL) and the pump shows 0.0 IOB. The pump offers another 3-unit correction. You take it. Ninety minutes later, you are hypoglycaemic.
The model had reached zero. Your physiology had not. Roughly 2 units were still working.
Example 4: The same exercise gives three different results
Same 20-minute walk on three different mornings on an AID system. No breakfast, no bolus.
- Day 1, 0.0 IOB: glucose stable.
- Day 2, negative IOB: glucose rises during activity.
- Day 3, 1.1 units IOB: glucose falls fast.
The walk was identical. The driver was the circulating insulin at the start, shaped by everything that had happened in the previous hours.
Shorter AIT improves correction freedom but hides exercise hypoglycaemia risk. Longer AIT shows insulin exposure but can block corrections when carbohydrates are underestimated. Part 2 explains the three IOB models that produce these trade-offs.
Part 1 of 4
The Insulin On Board to Physiology Mismatch