
The IOB Guide for T1D: Part 2
Different Models For Calculating Insulin On Board
In a DAFNE classroom last month, two people in the same row compared their pumps two hours after lunch. Same dose to the gram, similar weight, similar meal. One screen read 4.2 units of insulin still active. The other read zero. Both screens were computing correctly. Both were missing what the body was actually doing.
Ask Grace
Want to talk through linear and curvilinear insulin models against your own settings? Ask Grace.
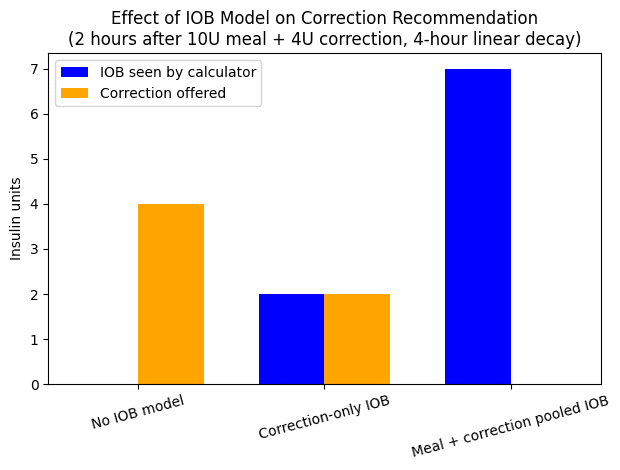
Three IOB model types are in production today. Each makes a different bet on the central trade-off between correction freedom and physiological visibility. The image below shows what every AIT setting misses; the rest of this part walks the three models and the structural trade-off they share.
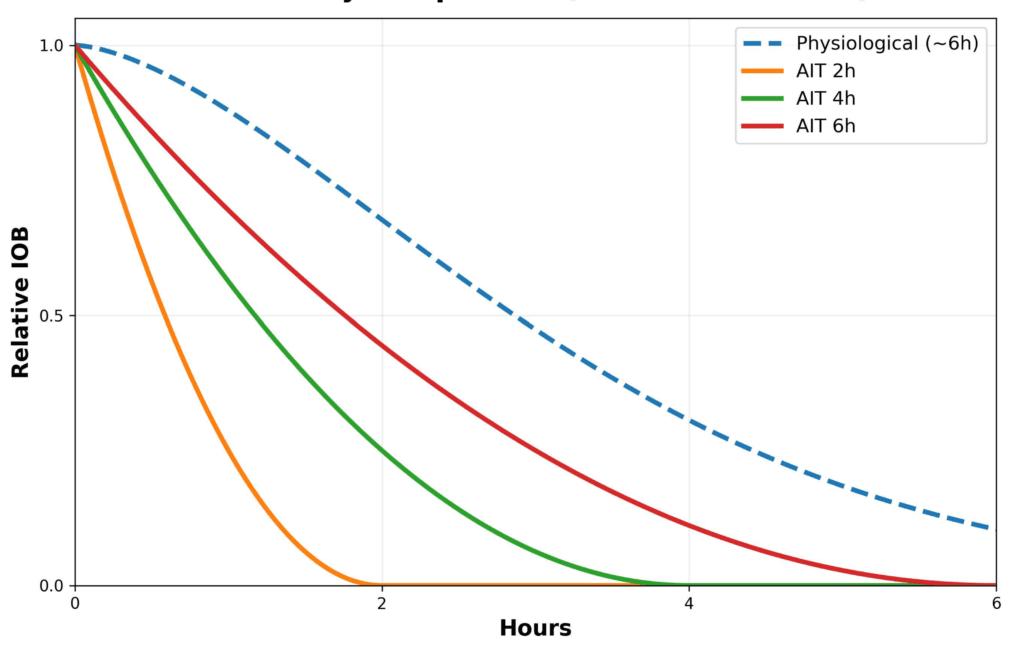
The meal insulin vs correction insulin problem
Most systems do not distinguish between insulin given for carbohydrate and insulin given for correction. They are lumped together as IOB. This is problematic because meal insulin is often still covering carbohydrate that has not yet finished digesting. Only the correction insulin is targeting excess glucose in circulation. Physiologically, these behave differently. Mathematically, most devices treat them the same.
High IOB blocks a correction
You take 14 units total: 10 units for food and 4 units for correction. Your AIT/DIA is set to 4 hours and the bolus calculator treats everything as one pool of IOB. Two hours later, when glucose is still entering circulation because your meal has not been fully digested, your glucose is 13.9 mmol/L (250 mg/dL) and rising. You expect a correction. The device says no.
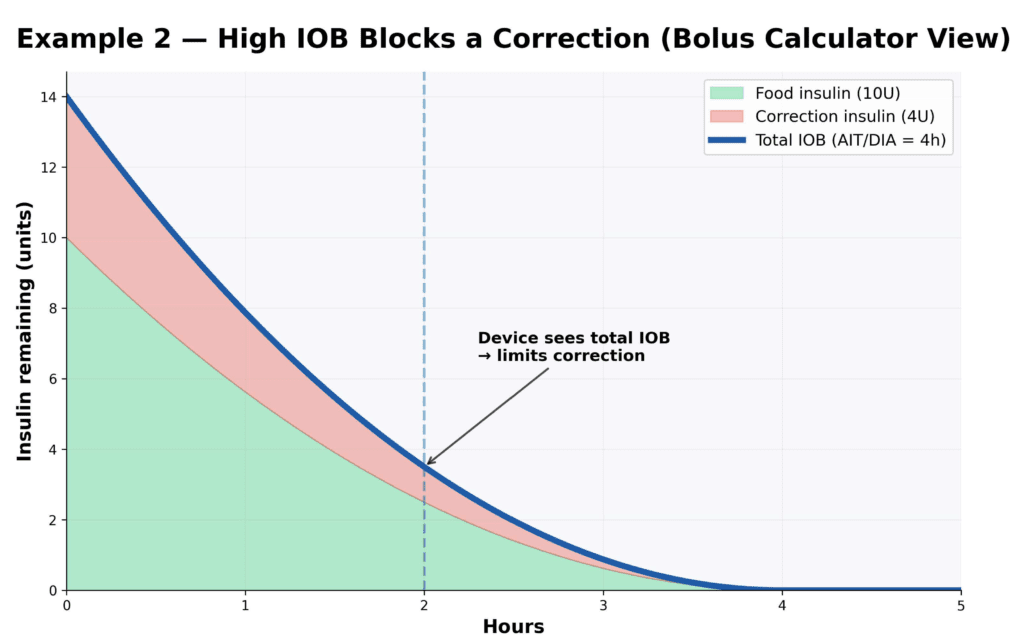
It sees approximately 4 units of total IOB and blocks insulin, even though only approximately 1 unit may be true correction insulin, and the rest is still covering food that has not been absorbed yet. When carbohydrate has been underestimated, which happens 30 to 50% of the time, the algorithm assumes it is preventing stacking by treating all bolus insulin as one pool.
The calculator does not know why insulin was given. It only knows how much was delivered and how much remains within the model. Most of the insulin still circulating is actually meal insulin working against carbohydrate absorption, not free correction insulin, which is the one that matters in this situation.
So what happens in real life? You override. You ghost-carb. You inject by pen. Glucose comes down. You avoid hours of hyperglycaemia. Later, someone says, “Just trust the technology.”
You may have a stronger word for that.
But this is not about trust. It is about modelling. The algorithm sees total risk. Humans think dynamically: food versus correction versus activity. These are the two jobs in conflict.
Why shortening AIT works for tighter glucose management
Consider someone who consistently runs high at 2 to 3 hours post-meal due to carbohydrate underestimation. With AIT set at 5 hours, the system may show substantial IOB and suppress a correction, because it assumes insulin is still active. But if much of that insulin is still dealing with unabsorbed carbohydrate, a correction may in fact be physiologically appropriate. So they shorten AIT to 2 hours, which reduces displayed IOB sooner and allows stronger corrections.
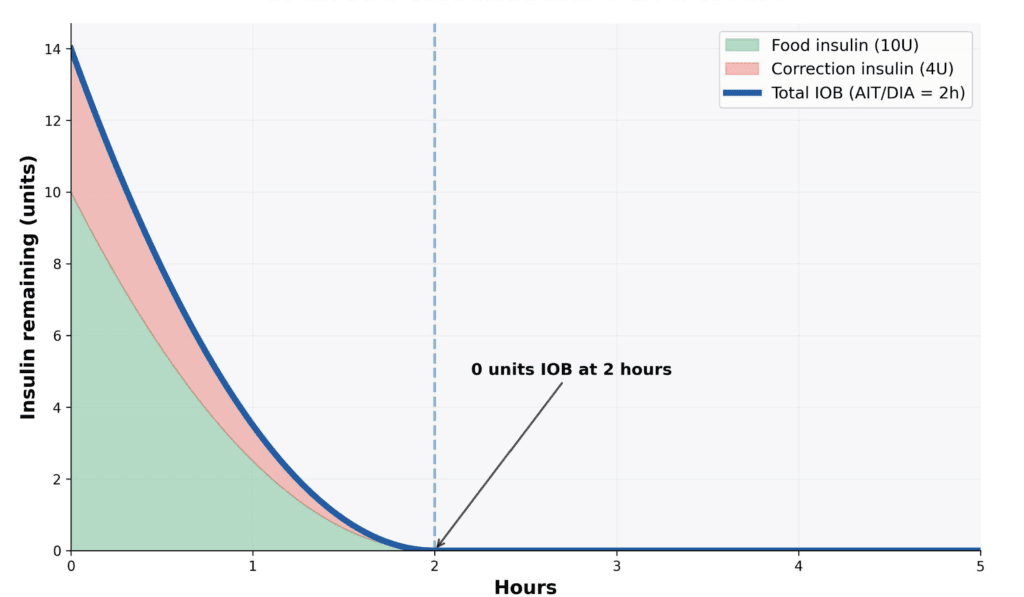
On paper, that looks logical. But physiologically, there is still correction insulin working in the background, about 2 units. The result: you may overshoot by roughly 2 units.
Now imagine there is no food involved, just a very high glucose, say 20 mmol/L (360 mg/dL), and you are correcting every two hours. Because the algorithm treats bolus insulin as effectively gone at 2 hours, it keeps offering full corrections each time. But in reality, some insulin from the previous dose is still active. This is where insulin stacking risk rises quickly.
Not user error: model architecture
A short AIT compresses the model’s memory of insulin action. When the screen shows 0.0 IOB, many people reasonably assume they are bolus insulin-free; that assumption can create a false sense of security, particularly before exercise.
The predictable results are: unexpected exercise hypoglycaemia, late crashes after stacked corrections, and loss of trust in the bolus calculator. This is not about good or bad settings. It is about what you are optimising for.
Not all IOB models are identical
There are three main approaches to how devices handle IOB in correction calculations.
Model 1: No IOB deduction from corrections
Some systems display IOB but do not use it to reduce correction recommendations. The full calculated correction is always offered. This approach gives maximum correction freedom but carries the highest insulin stacking risk. The displayed IOB, often calculated using a 4 to 6 hour duration, still provides useful information about total circulating insulin for exercise planning; this information is advisory only, not used by the calculator.
Model 2: Correction-only IOB
Only insulin given explicitly as a correction dose blocks further corrections. Meal boluses are excluded from the correction calculation. This improves correction logic and may reduce stacking from high-strength correction calculations. However, it risks over-correction early after meals, can underestimate true circulating insulin, and may increase hypoglycaemia risk with high-glycaemic meals or when pre-bolusing is inconsistent. It solves one problem but creates others.
Some bolus calculators that exclude meal insulin from correction logic still display both meal and correction insulin on the screen. This transparency helps mitigate the risk. It is essential to check how your system presents this information.
Model 3: Total IOB (meal plus correction pooled)
All insulin, both meal and correction, counts against further corrections. This provides the most stacking protection and the most realistic representation of total circulating insulin for exercise risk. The trade-off is that it can block needed corrections when carbohydrates are underestimated, and may produce persistent hyperglycaemia if corrections are restricted for too long.
The trade-off nobody explains
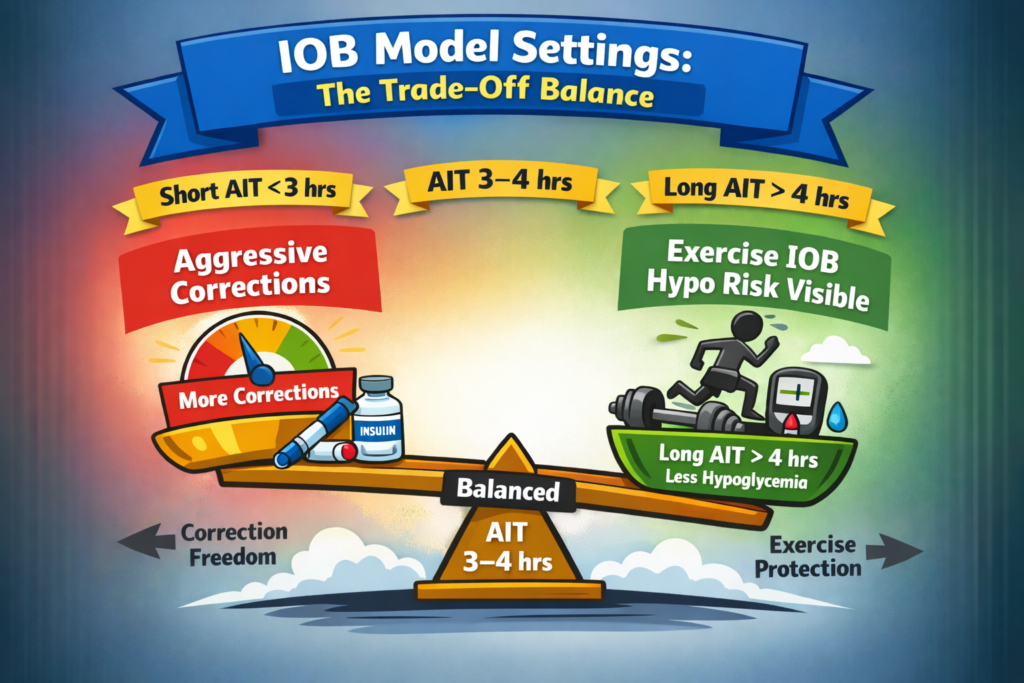
You can optimise AIT for correction performance (shorter AIT, 2 to 3 hours) or for physiological accuracy (longer AIT, 4 to 6 hours). But you cannot perfectly optimise for both at the same time if meal and correction insulin are grouped together. This is the structural limitation of current IOB models. It is not user error. It is a model architecture decision.
Shorter AIT (2 to 3 hours)
- Stronger corrections
- Lower IOB deducted sooner
- Greater correction freedom
- Lower visibility of circulating insulin
- Higher exercise hypoglycaemia risk
Longer AIT (4 to 6 hours)
- More stacking protection
- More IOB deducted for longer
- Corrections more restricted
- Better visibility of circulating insulin
- Better exercise hypoglycaemia risk awareness
Linear vs curvilinear decay models
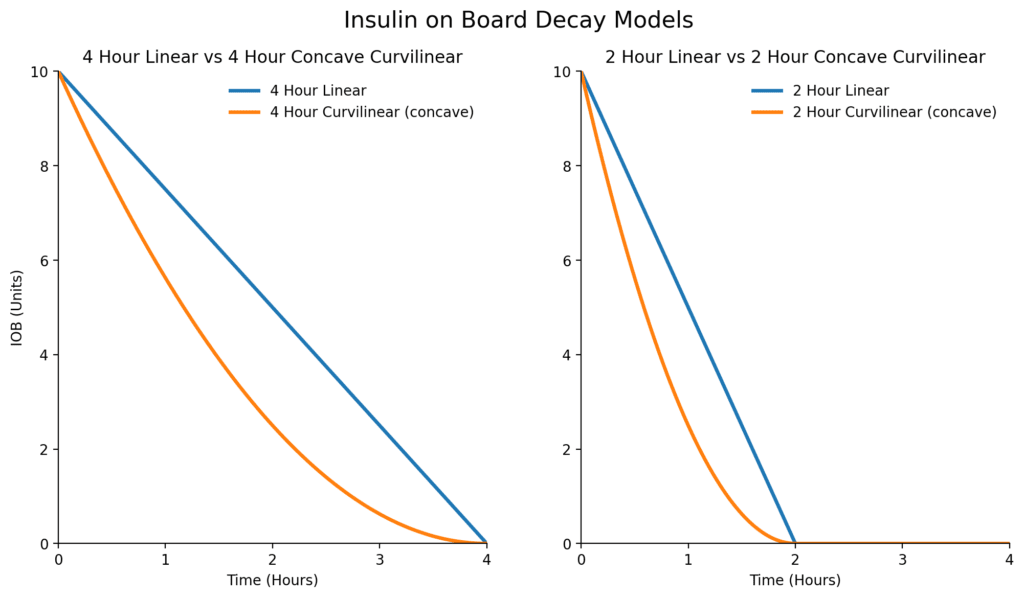
Most commercial systems use one of two mathematical decay shapes. Linear degradation means insulin declines evenly over time. Curvilinear degradation means insulin falls more steeply early on, with a longer tail, which more closely mirrors actual pharmacodynamics.
In the curvilinear model, insulin action is front-loaded. The greatest glucose-lowering effect occurs in the first two hours after dosing. After this early peak phase, the rate of effect progressively slows. However, the chosen AIT/DIA duration matters far more than the exact curve shape; getting the duration broadly right is the major issue, whether the curve is linear or slightly curved is minor in comparison.
Advanced models: offset, peak, and meal-rise settings
Some systems move beyond a simple one decay curve model by introducing the idea of the expected glucose rise after eating. Three settings allow personalisation:
- Meal-rise expectation: an estimate of the peak glucose typical after meals for that individual (1.7 to 5.6 mmol/L or 30 to 100 mg/dL).
- Offset time: at what point does glucose start to decrease from the peak meal-rise (45 to 120 minutes).
- Acting time: an estimate of how long the insulin lasts (3 to 8 hours), creating the drop-off from the end of the offset time.
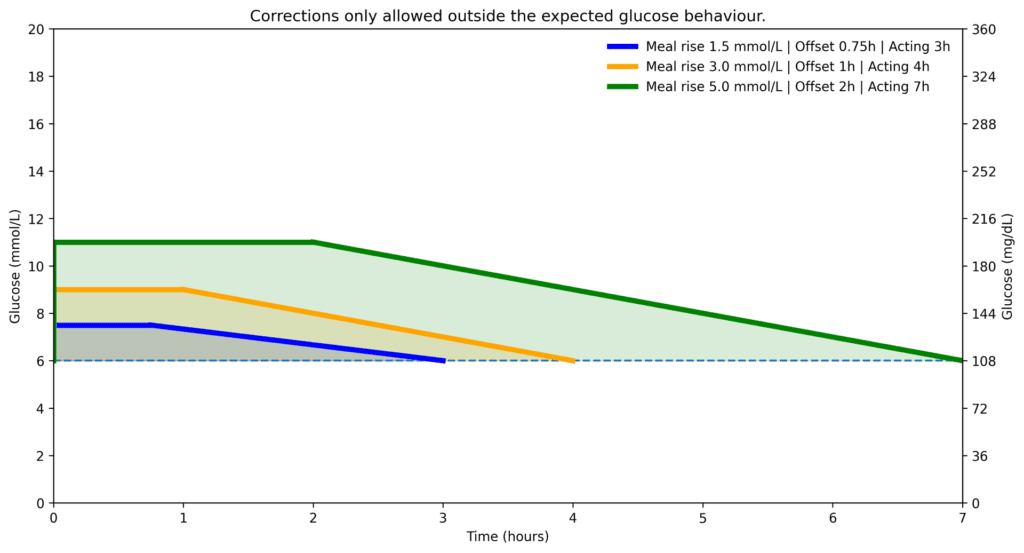
With this model, corrections during the expected glucose rise phase are restricted, but once the glucose trajectory is expected to start falling, corrections become available again. This means the system avoids blocking corrections when they are genuinely needed, which is a meaningful improvement over pooled IOB models for post-meal management.
AID and hybrid closed-loop systems: an extra layer of complexity
Automated Insulin Delivery systems add a second layer: a user-facing bolus calculator and an internal control algorithm. These layers may not use the same insulin accounting. In practice, displayed IOB may not reflect total insulin exposure generated by automation.
Most systems distinguish between user-entered correction boluses and algorithm-driven micro-corrections, and may apply different decay assumptions to each. When insulin delivery falls below the expected level, this may display as negative IOB, indicating that circulating insulin exposure is lower than anticipated, which can help refine understanding of hypoglycaemia risk.
The key implication: what is displayed on screen may not fully represent what the algorithm is accounting for in the background. Despite these structural differences, the central tension remains. Insulin modelling must balance protection against over-correction while reflecting the front-loaded physiological action of rapid-acting insulin.
Part 3 walks through how each named UK system implements these models in practice. The detailed workarounds and risks live there, mapped to specific systems. For the deepest review of net IOB in the literature, the netIOB article from Professor Michael Riddell is the canonical reference.
Part 2 of 4
Different Models For Calculating Insulin On Board