
Core Guide
Activity Snacking: Ten Minutes After Meals
A short walk after a meal is one of the most underused levers in day-to-day glucose management. Cheap, repeatable, and it runs on the same physiology as everything else in this guide, insulin action amplified by movement. No training plan required, no fitness goal attached.
Ask Grace
Curious what ten minutes of movement after a meal actually does to your glucose? Ask Grace.
Ten minutes after meals: the most underused lever in T1D
A short walk after meals is one of the most underrated tools in type 1 diabetes management. Movement creates glucose uptake demand at exactly the time glucose is rising from a meal. The result tends to be a lower post-meal peak and a gentler curve, without adding complexity to an exercise management plan.
- Starting with ten minutes after the meal that produces your biggest spike is a practical entry point.
- A pace you can repeat daily works better than an ambitious pace you cannot sustain.
- CGM provides the feedback: you are looking for a lower peak and a gentler descent.
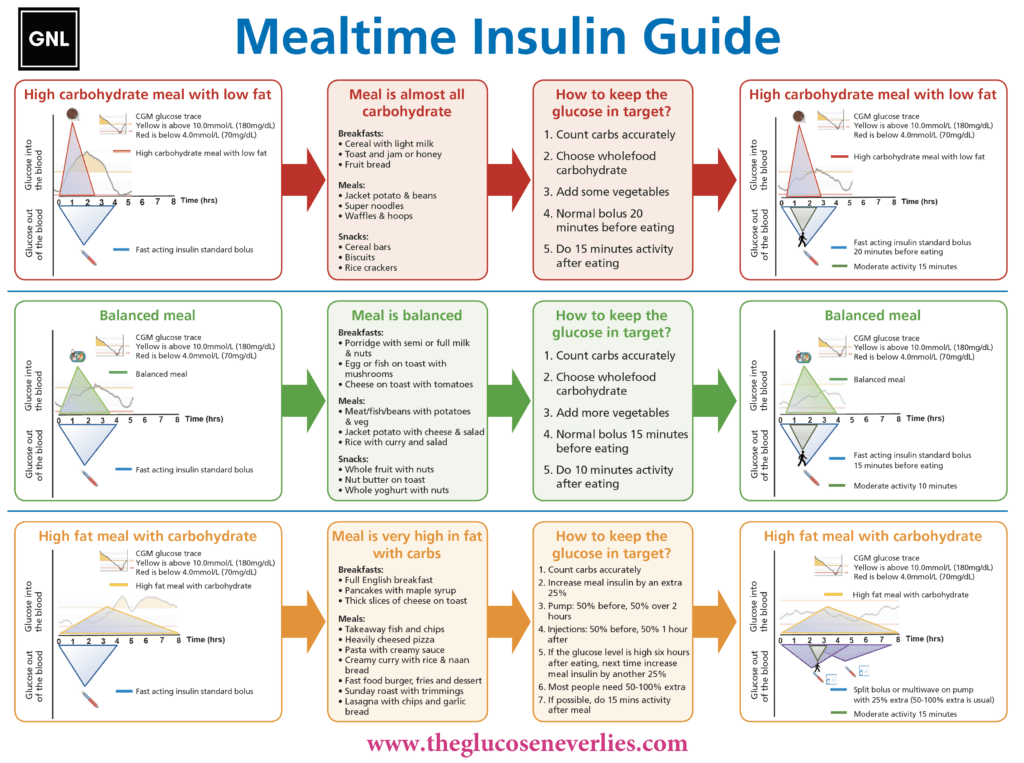
Activity snacking when glucose is elevated between meals (20 by 2 and 20 by 40)
Light activity amplifies the effect of insulin already on board. For some people, this can meaningfully lower glucose without stacking further insulin corrections, particularly in the window when a previous dose of rapid-acting insulin is still active, broadly the four hours or so after it was given. This is not a replacement for insulin when insulin is needed; it is a tool for the right situation.
- Twenty minutes of light activity tends to lower glucose by around 2 mmol/L (about 40 mg/dL) on average, when there is still insulin on board from a dose given in roughly the last four hours.
- In a matched-pair analysis of 1,546 activity bouts starting above 10 mmol/L, glucose fell by a mean of 2.2 mmol/L at twenty minutes, against a mean rise of 0.3 mmol/L over the same window with no activity; hypo risk during the activity itself was under 2 percent.
- Often faster than waiting on a correction dose, which typically needs 60 to 90 minutes to show its full effect; a short walk can start moving glucose within minutes.
- This is a population-average effect; individual response size and timing vary, and CGM is the tool for observing your own pattern.
- Activity is not appropriate when ketones are elevated; in that situation, sick-day rules apply.
- Whether and when to use activity snacking this way is the person with diabetes’ own call, made with their diabetes care team, not a rule applied to them.
The GNL Activity Snacking (20 by 2) approach describes this in more depth. Download the reference sheets: 20 by 2 (PDF) and 20 by 40 (PDF). Hear the physiology discussed in full: Episode 8, Activity Snacking to Increase Time in Range on the GNL Podcast.
Two worked examples: how much insulin is still active at 90 and 180 minutes
The Walking to Lower a High explorer estimates the glucose drop from a 10, 20, or 30 minute walk using the insulin still physiologically active in the body, not the number a pump or AID displays as insulin on board. These two examples show why that distinction matters even well outside the first hour after a dose.
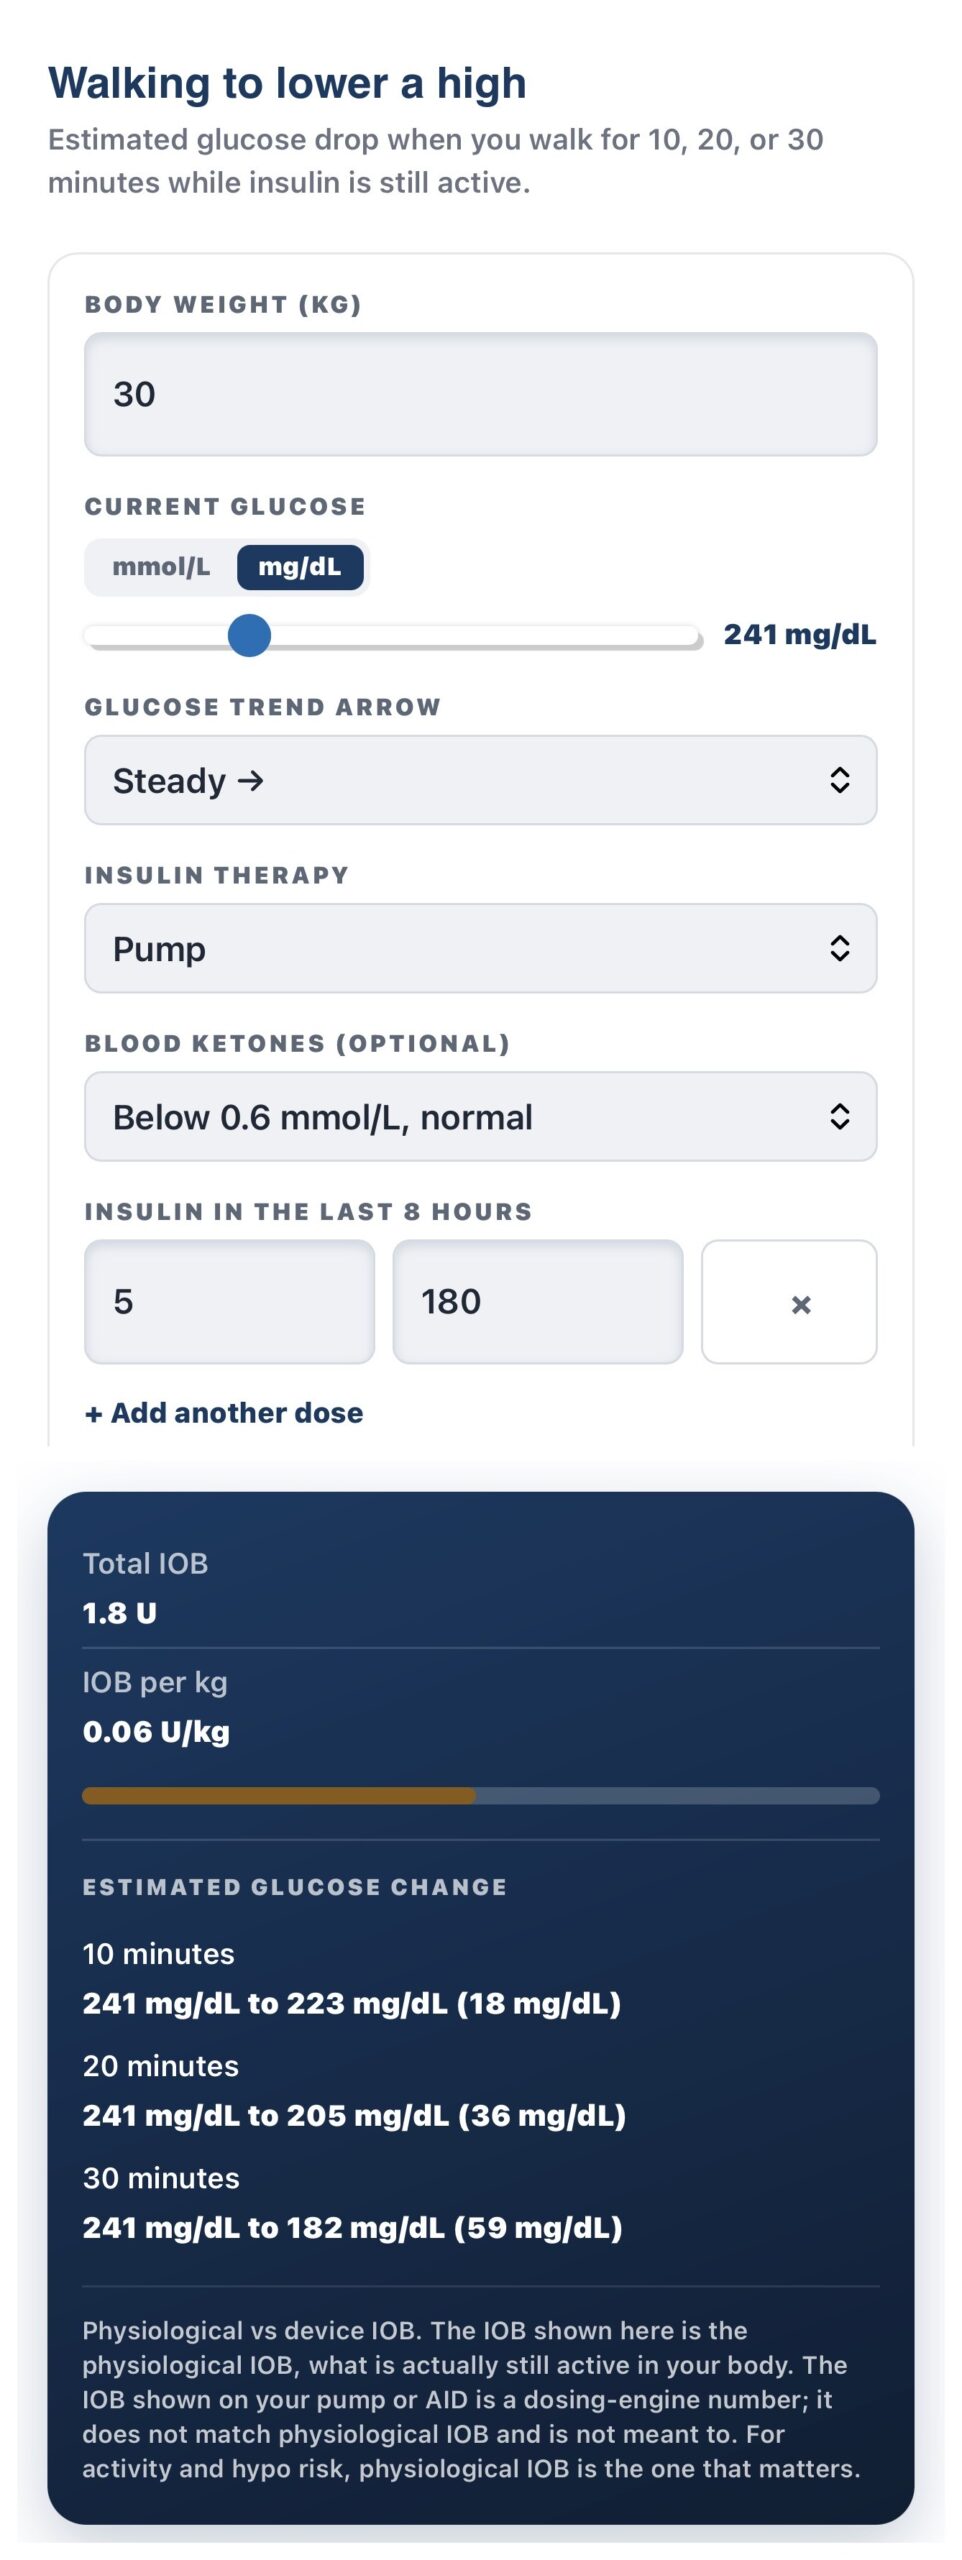
- 180 minutes (mg/dL example). A 30 kg person on 5 U starts at 241 mg/dL. Even three hours after the dose, 1.8 U is still physiologically active. A 10-minute walk is estimated to bring this to 223 mg/dL, 20 minutes to 205 mg/dL, and 30 minutes to 182 mg/dL.
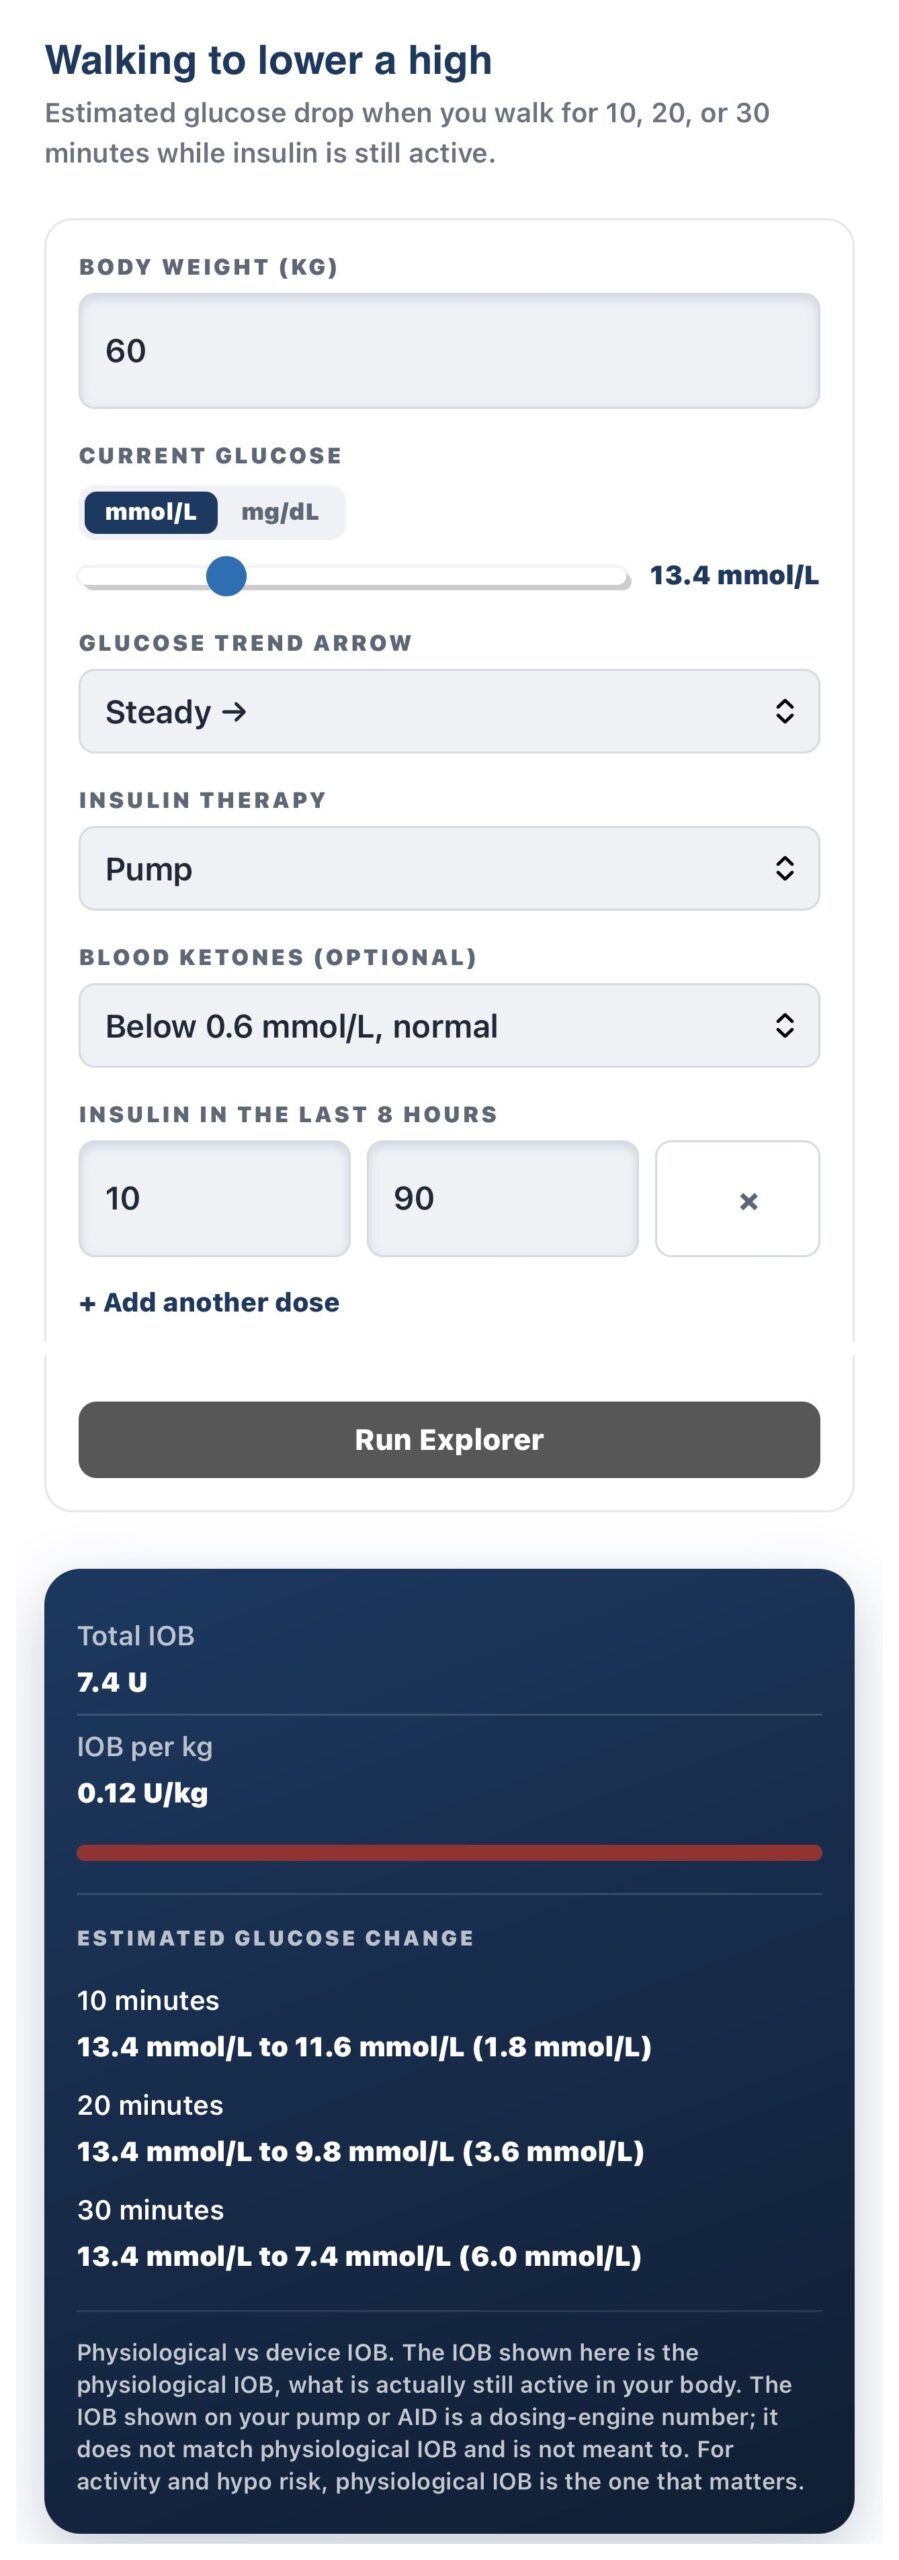
- 90 minutes (mmol/L example). A 60 kg person on 10 U starts at 13.4 mmol/L. At 90 minutes, insulin action is near its peak, with 7.4 U still physiologically active. A 10-minute walk is estimated to bring this to 11.6 mmol/L, 20 minutes to 9.8 mmol/L, and 30 minutes to 7.4 mmol/L.
- Physiological IOB versus device IOB. The IOB a pump or AID displays is a dosing-engine number, built to guide the next dose safely; it is not meant to match the insulin actually still active in the body, and it usually understates how long that action really runs. For activity and hypo risk specifically, physiological IOB is the number that matters, and it is why a walk can still meaningfully amplify insulin action two or three hours after a dose, well after most devices have stopped showing much on board.
- This is a population-average estimate; individual response varies with insulin type, dose, and person. It is not a substitute for the diabetes care team’s guidance on hypo risk during activity.
Fast movers and slow movers: knowing which you are
Activity does not just “burn glucose”; it amplifies insulin action. Some people experience a rapid glucose fall with even light movement because activity dramatically boosts the effect of insulin already on board (fast movers). Others see a slower or smaller response because there is less active insulin to amplify.
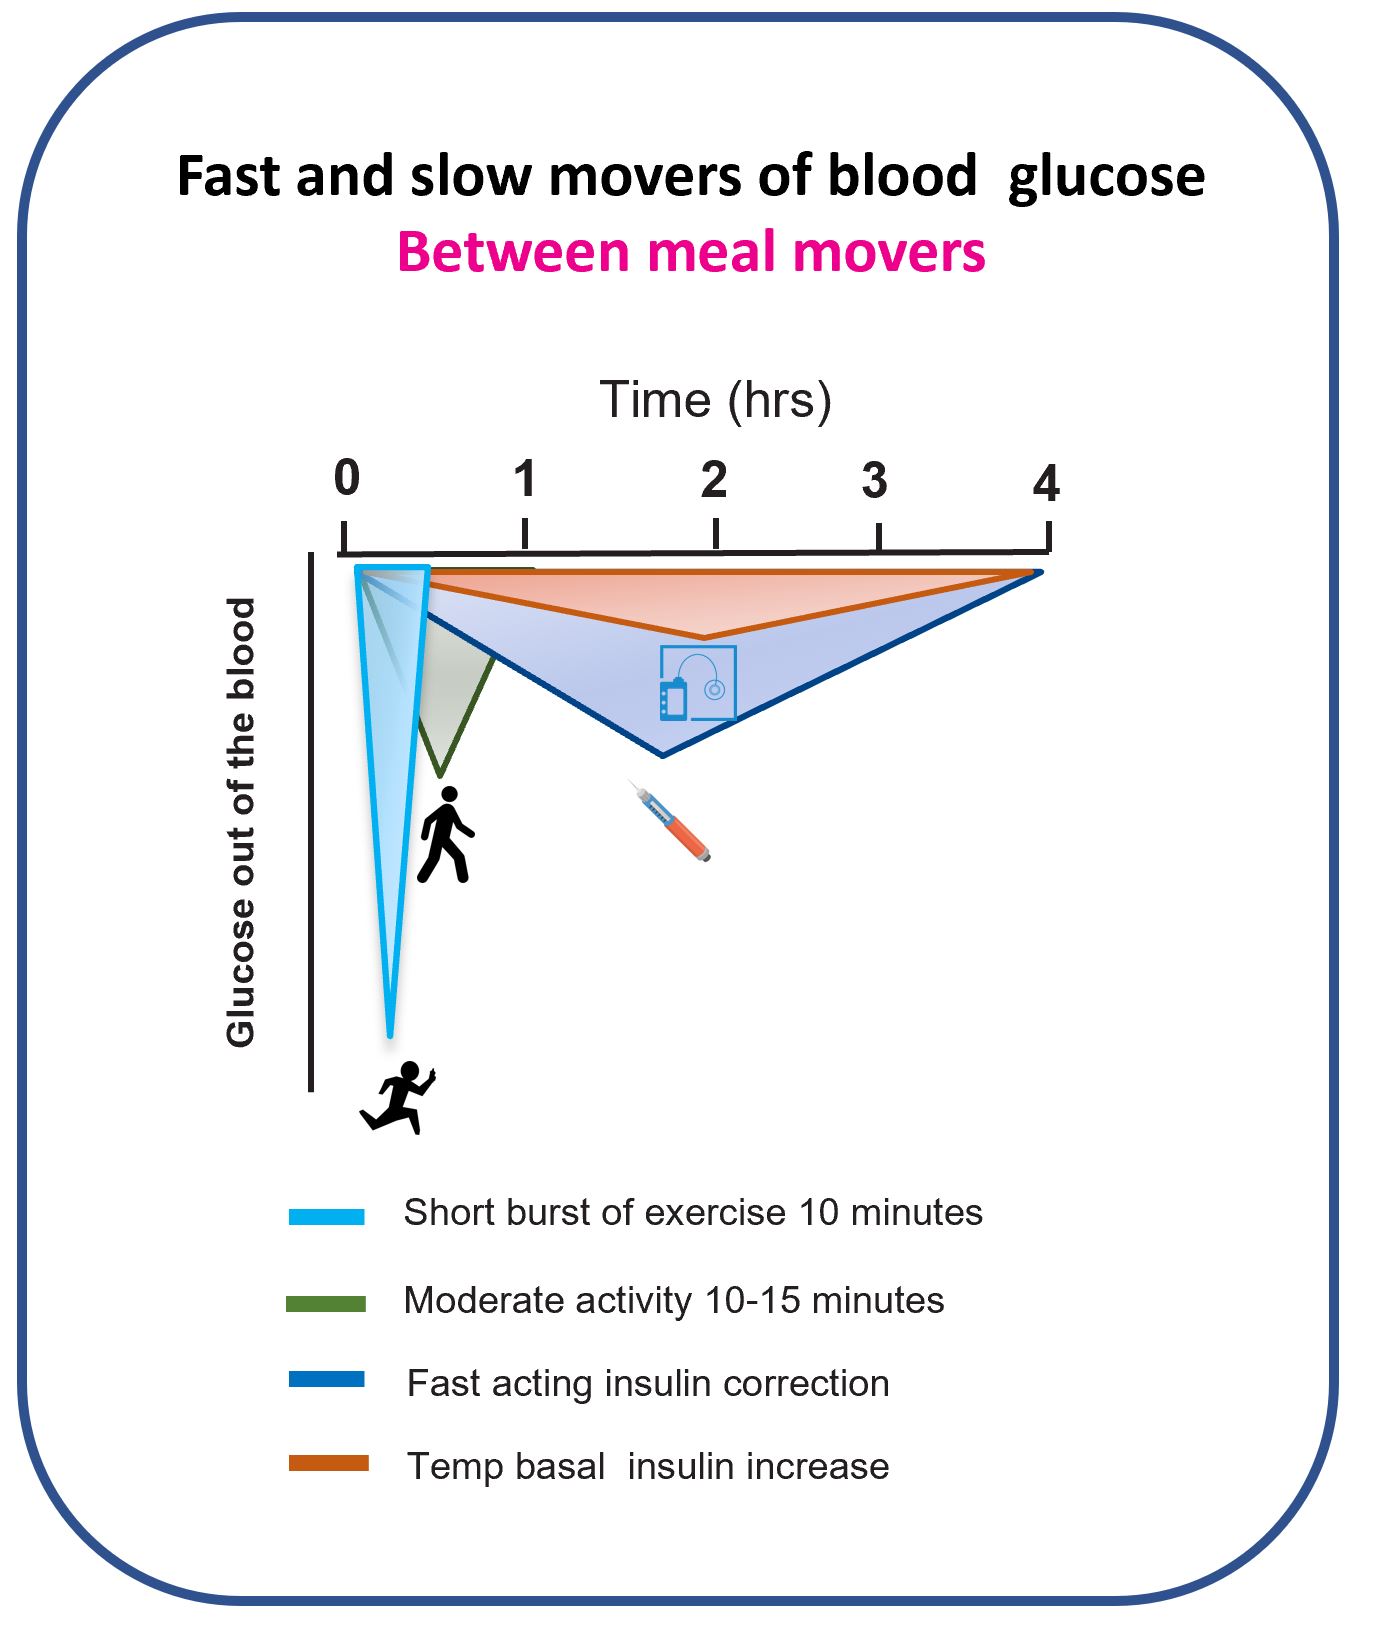
Knowing the approximate amount of insulin on board helps with dosing movement and optimising time in range. Explore further: Fast and slow movers, understanding your individual activity response.
CGM as activity biofeedback: what to look for
CGM makes activity more useful because it converts vague advice (“be more active”) into visible, real-time feedback. The signals to look for are:
- lower post-meal peaks,
- less time spent in the high range,
- fewer correction cycles needed.
For families, CGM has an additional benefit: children can see movement changing glucose in real time, which tends to build confidence and reduce fear around activity.
See the full CGM series: CGM Series, How to Choose a CGM.
What GNL research shows
The 20-minute paradigm
Pemberton et al (2025) identified that twenty minutes of moderate activity, timed into the post-meal window, is often enough to blunt a postprandial rise without triggering a later hypo, provided insulin on board and trend direction are accounted for. This reframes activity from an all-or-nothing risk to a precision tool. Developed further in Pemberton, Russon et al (2025) causal modelling work quantifying the effect directly.
Activity Snacking Knowledge Check
You have read the case for ten easy minutes after a meal. A short assessment on activity snacking follows, and 9 out of 10 earns your certificate.
References
Pemberton et al 2025, duration of physical activity to ameliorate hyperglycaemia (T1DEXI cohorts)
Pemberton J, Li Z, Gal RL, Turner LV, Bergford S, Calhoun P, Riddell MC. Duration of physical activity required to ameliorate hyperglycemia without causing hypoglycemia in type 1 diabetes: a T1DEXI adults and paediatric cohort analyses. Diabetes Research and Clinical Practice. 2025;220:111981. doi:10.1016/j.diabres.2024.111981. COI flag: John Pemberton is lead author.
Pemberton, Russon et al 2026, the 20-minute paradigm shift (Diabetic Medicine)
Pemberton JS, Russon CL, Pulsford RM, Metcalf BS, Cockcroft E, Allen MJ, Frohock AM, Andrews RC. Physical activity (20 min) is a powerful adjunct to insulin for correcting hyperglycaemia in type 1 diabetes: a paradigm shift. Diabetic Medicine. 2026;43(1):e70163. doi:10.1111/dme.70163. COI flag: John Pemberton is lead author. The source of the “20 minutes, around 2 mmol/L (40 mg/dL)” figure used on this page.
Pemberton, Russon et al 2025, causal modelling and matched-pair analysis (Diabetic Medicine)
Pemberton JS, Russon CL, Pulsford RM, Metcalf BS, Cockcroft E, Allen MJ, Frohock AM, Andrews RC. Glucose-lowering effects of physical activity in type 1 diabetes: a causal modelling and matched-pair analysis approach. Diabetic Medicine. 2025;42(12):e70146. doi:10.1111/dme.70146. COI flag: John Pemberton is lead author. Within-subject matched-pairs design, 1,546 activity bouts from 482 T1DEXI and T1DEXIP participants; the source of the mean -2.2 mmol/L at 20 minutes versus +0.3 mmol/L (no activity) figures used on this page.
Read more on GNL
This guide is educational. It describes average responses and general principles. It is not medical advice and cannot replace individual clinical guidance from your diabetes care team.