
Dynamic Glucose Management
MATCH: Prevent Lows with Precise Glucose Dosing
Preventing and treating hypoglycaemia using glucose, not sugar, with the dose matched to where someone is on their CGM and how fast they are falling.
Ask Grace
Want to think through what is driving your lows before they happen? Ask Grace.
What is MATCH?
MATCH is the Prevent Lows pillar of Dynamic Glucose Management. The mechanism: prevent and treat hypoglycaemia with glucose (not sugar), and match the amount of glucose to current level and rate of fall. The specific amount sits with each person’s diabetes care team; the framework on this page is the population-average teaching, not a personalised dose.
This matters because over-treating hypos, or using sugar, often creates the same rollercoaster: low, panic eating, rebound high, correction, repeat.
Two principles to hold onto:
- The gut maxes out at about 1 gram of glucose absorbed per minute.
- It takes roughly 20 minutes for a treatment to show up clearly on CGM.
The skill is not perfection. It is fast feedback: dose, wait, read the curve, then adjust next time.
Video overview: preventing and treating hypos
Watch: MATCH, Preventing and treating hypoglycaemia (YouTube)
Why sugar tends to be a poor choice for hypo treatment
The key mechanism: half the grams in sugar are fructose, and fructose is stored in the liver rather than entering the bloodstream directly. So roughly only half of a sugar-based treatment actually addresses the hypoglycaemia.
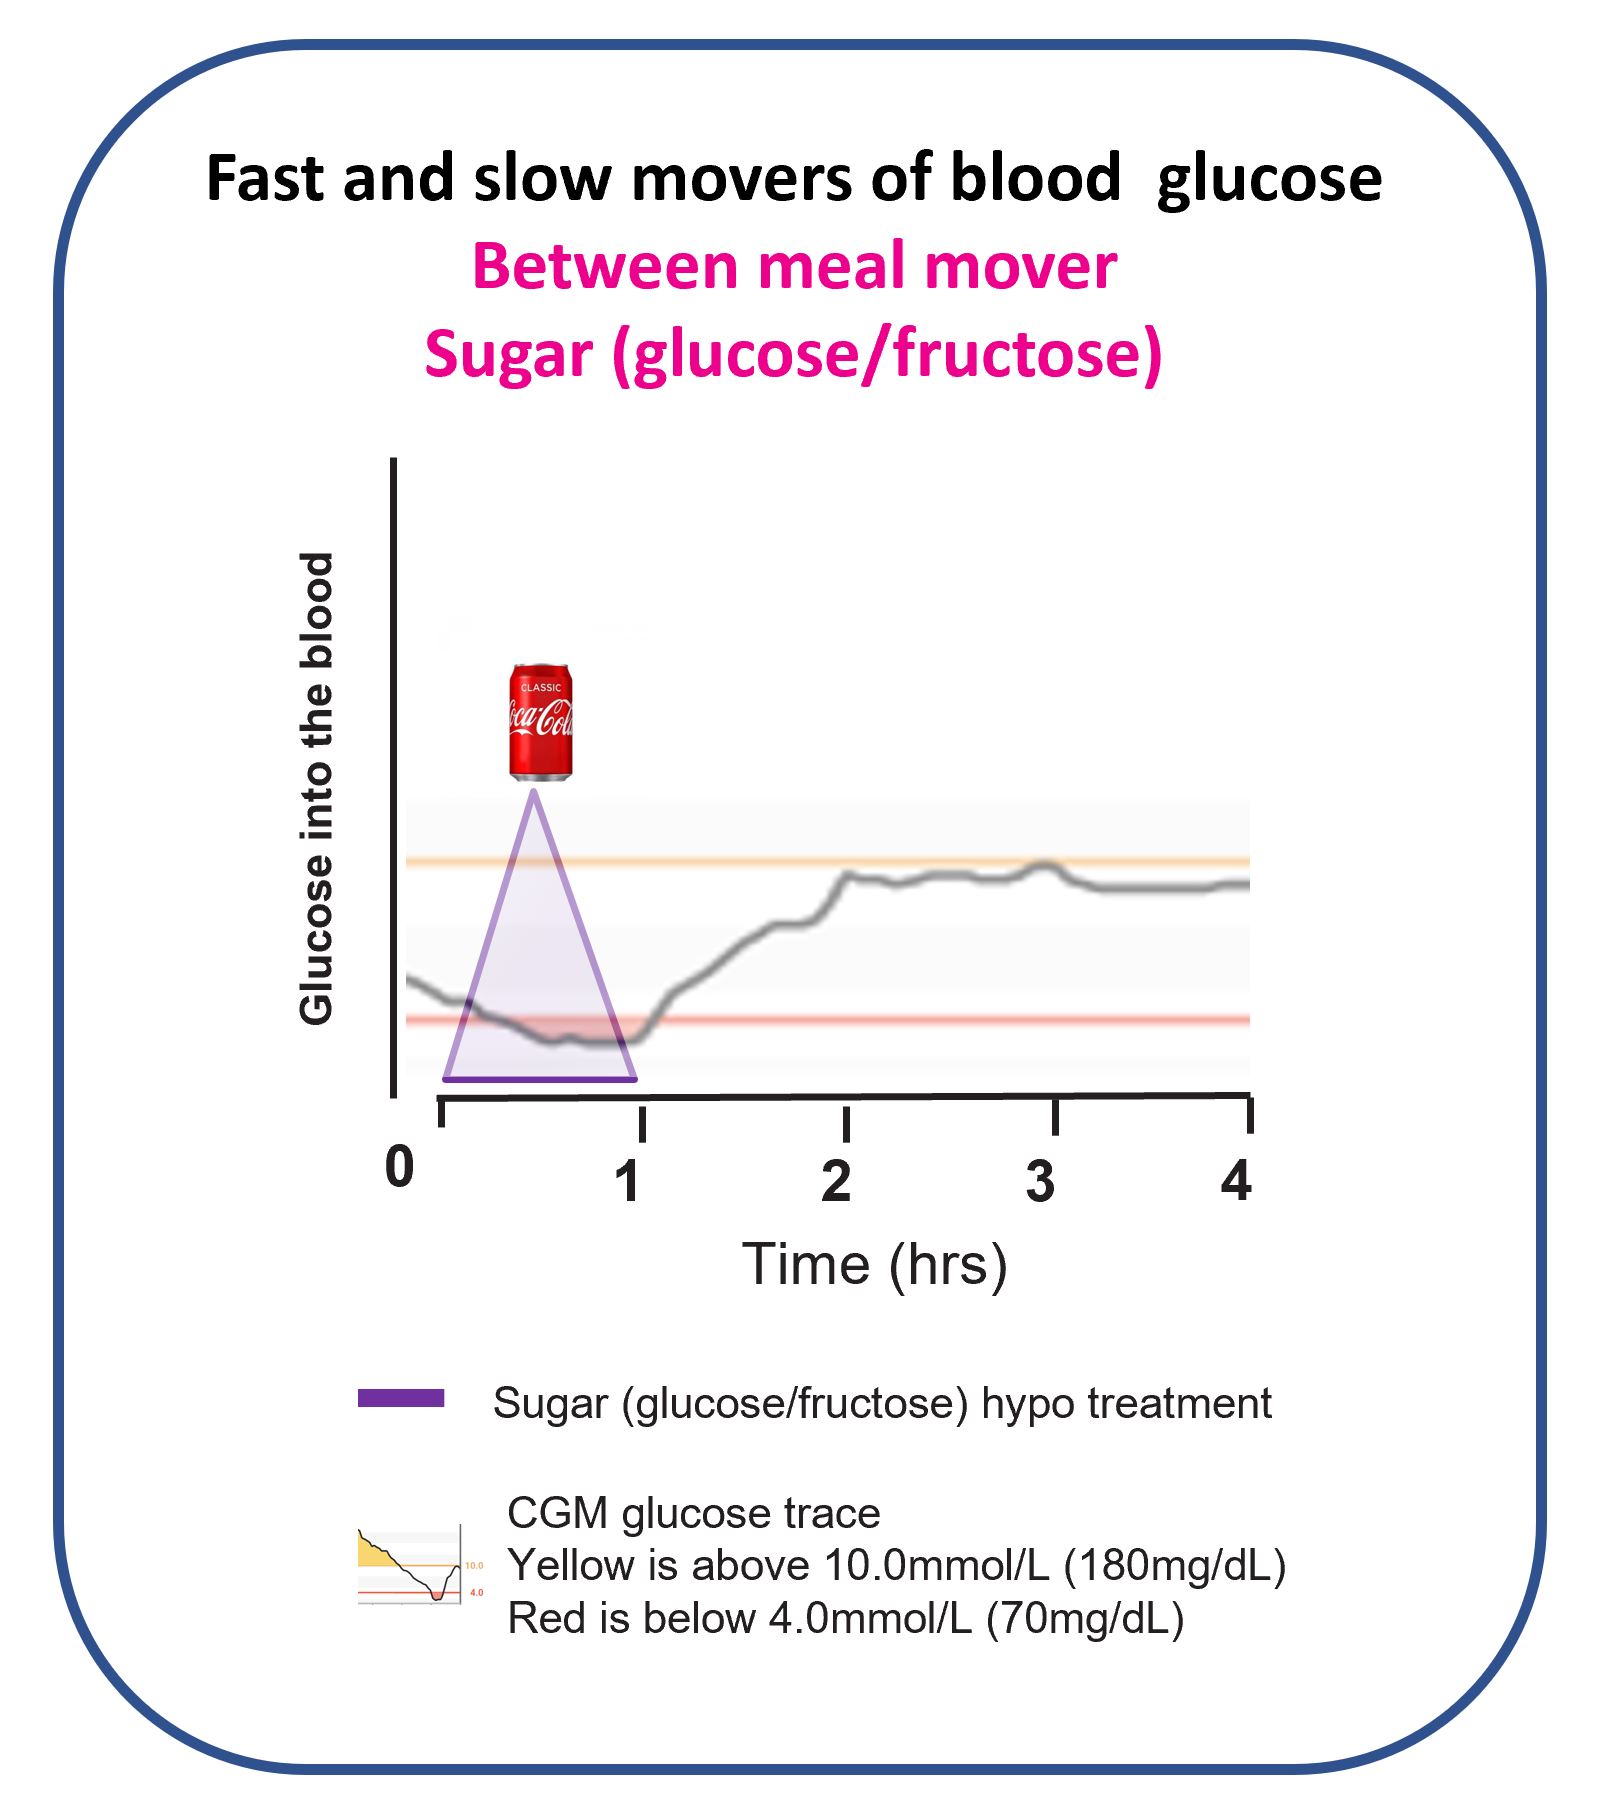
This is exactly why some people end up needing repeated treatments, and then often rebound straight back up high.
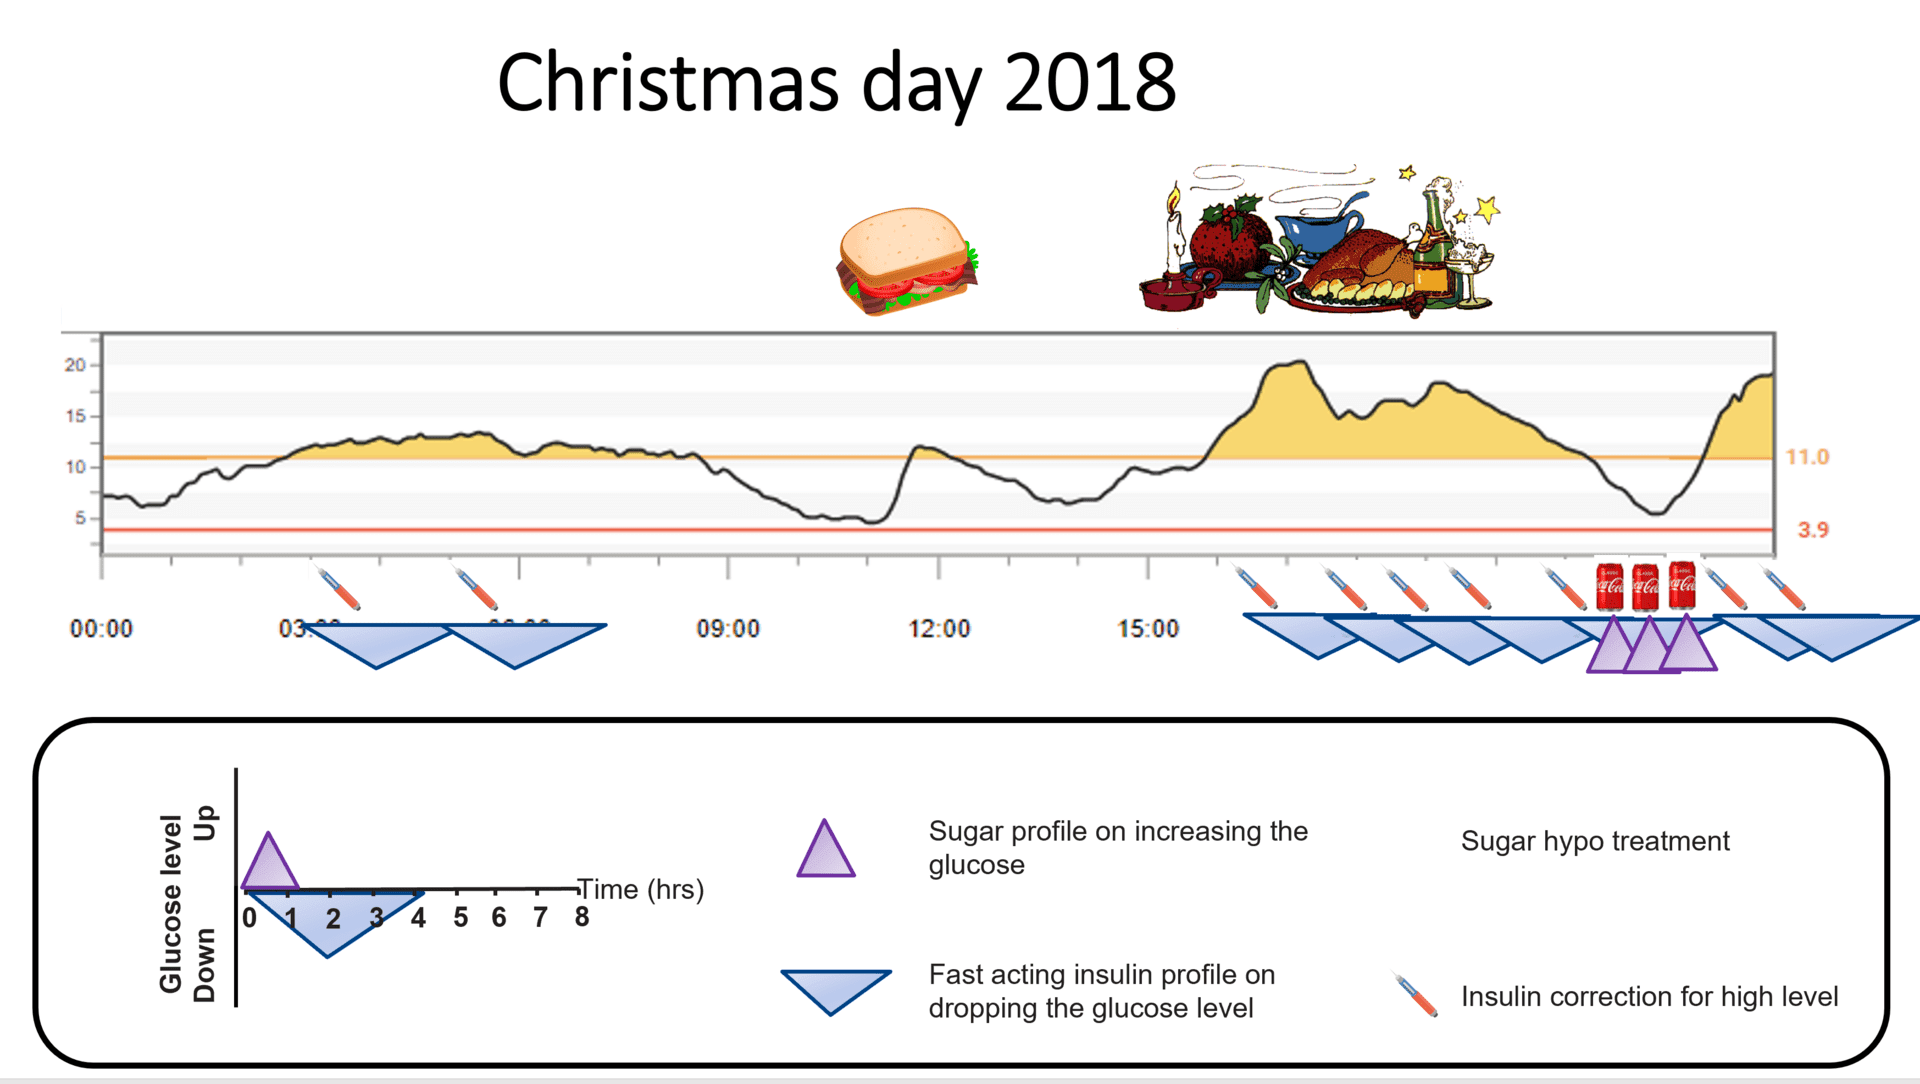
This pattern, the sugar rollercoaster, is something many people recognise before discovering Dynamic Glucose Management.
There is a second mechanism worth understanding: flooding the liver with fructose can activate pathways that promote hunger and overeating, compounding the difficulty of accurate hypo management.
Rick Johnson’s research on sugar and metabolic signalling (Peter Attia podcast)
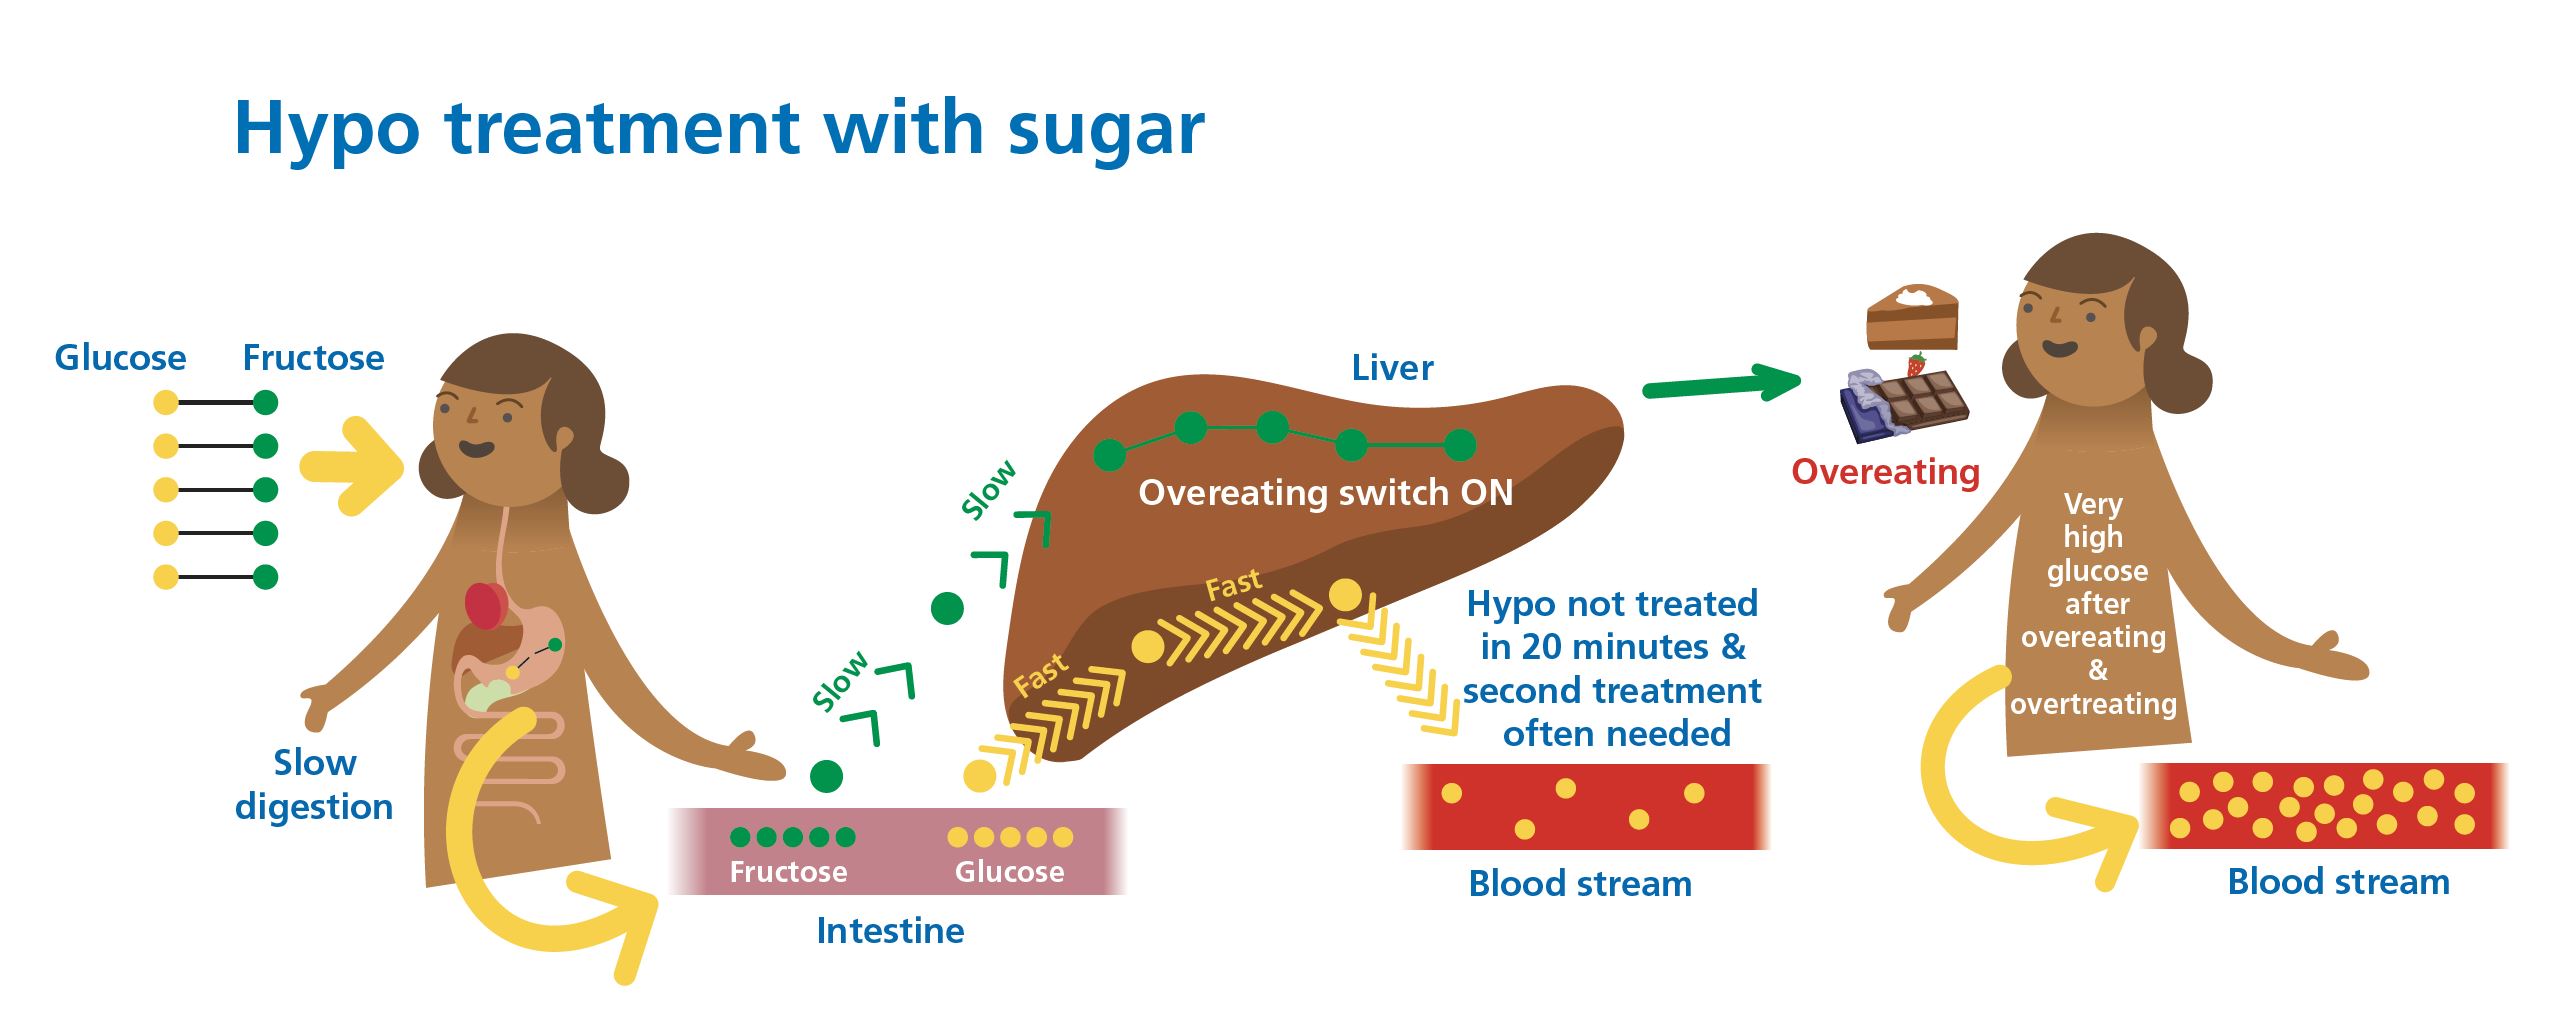
Sugar creates a compounding pattern: slow correction + repeat dosing + liver fructose = rebound highs and hunger dysregulation.
Why glucose works better
Pure glucose enters the bloodstream directly without the fructose diversion. The absorption is faster, more predictable, and the dose-response is easier to calibrate.
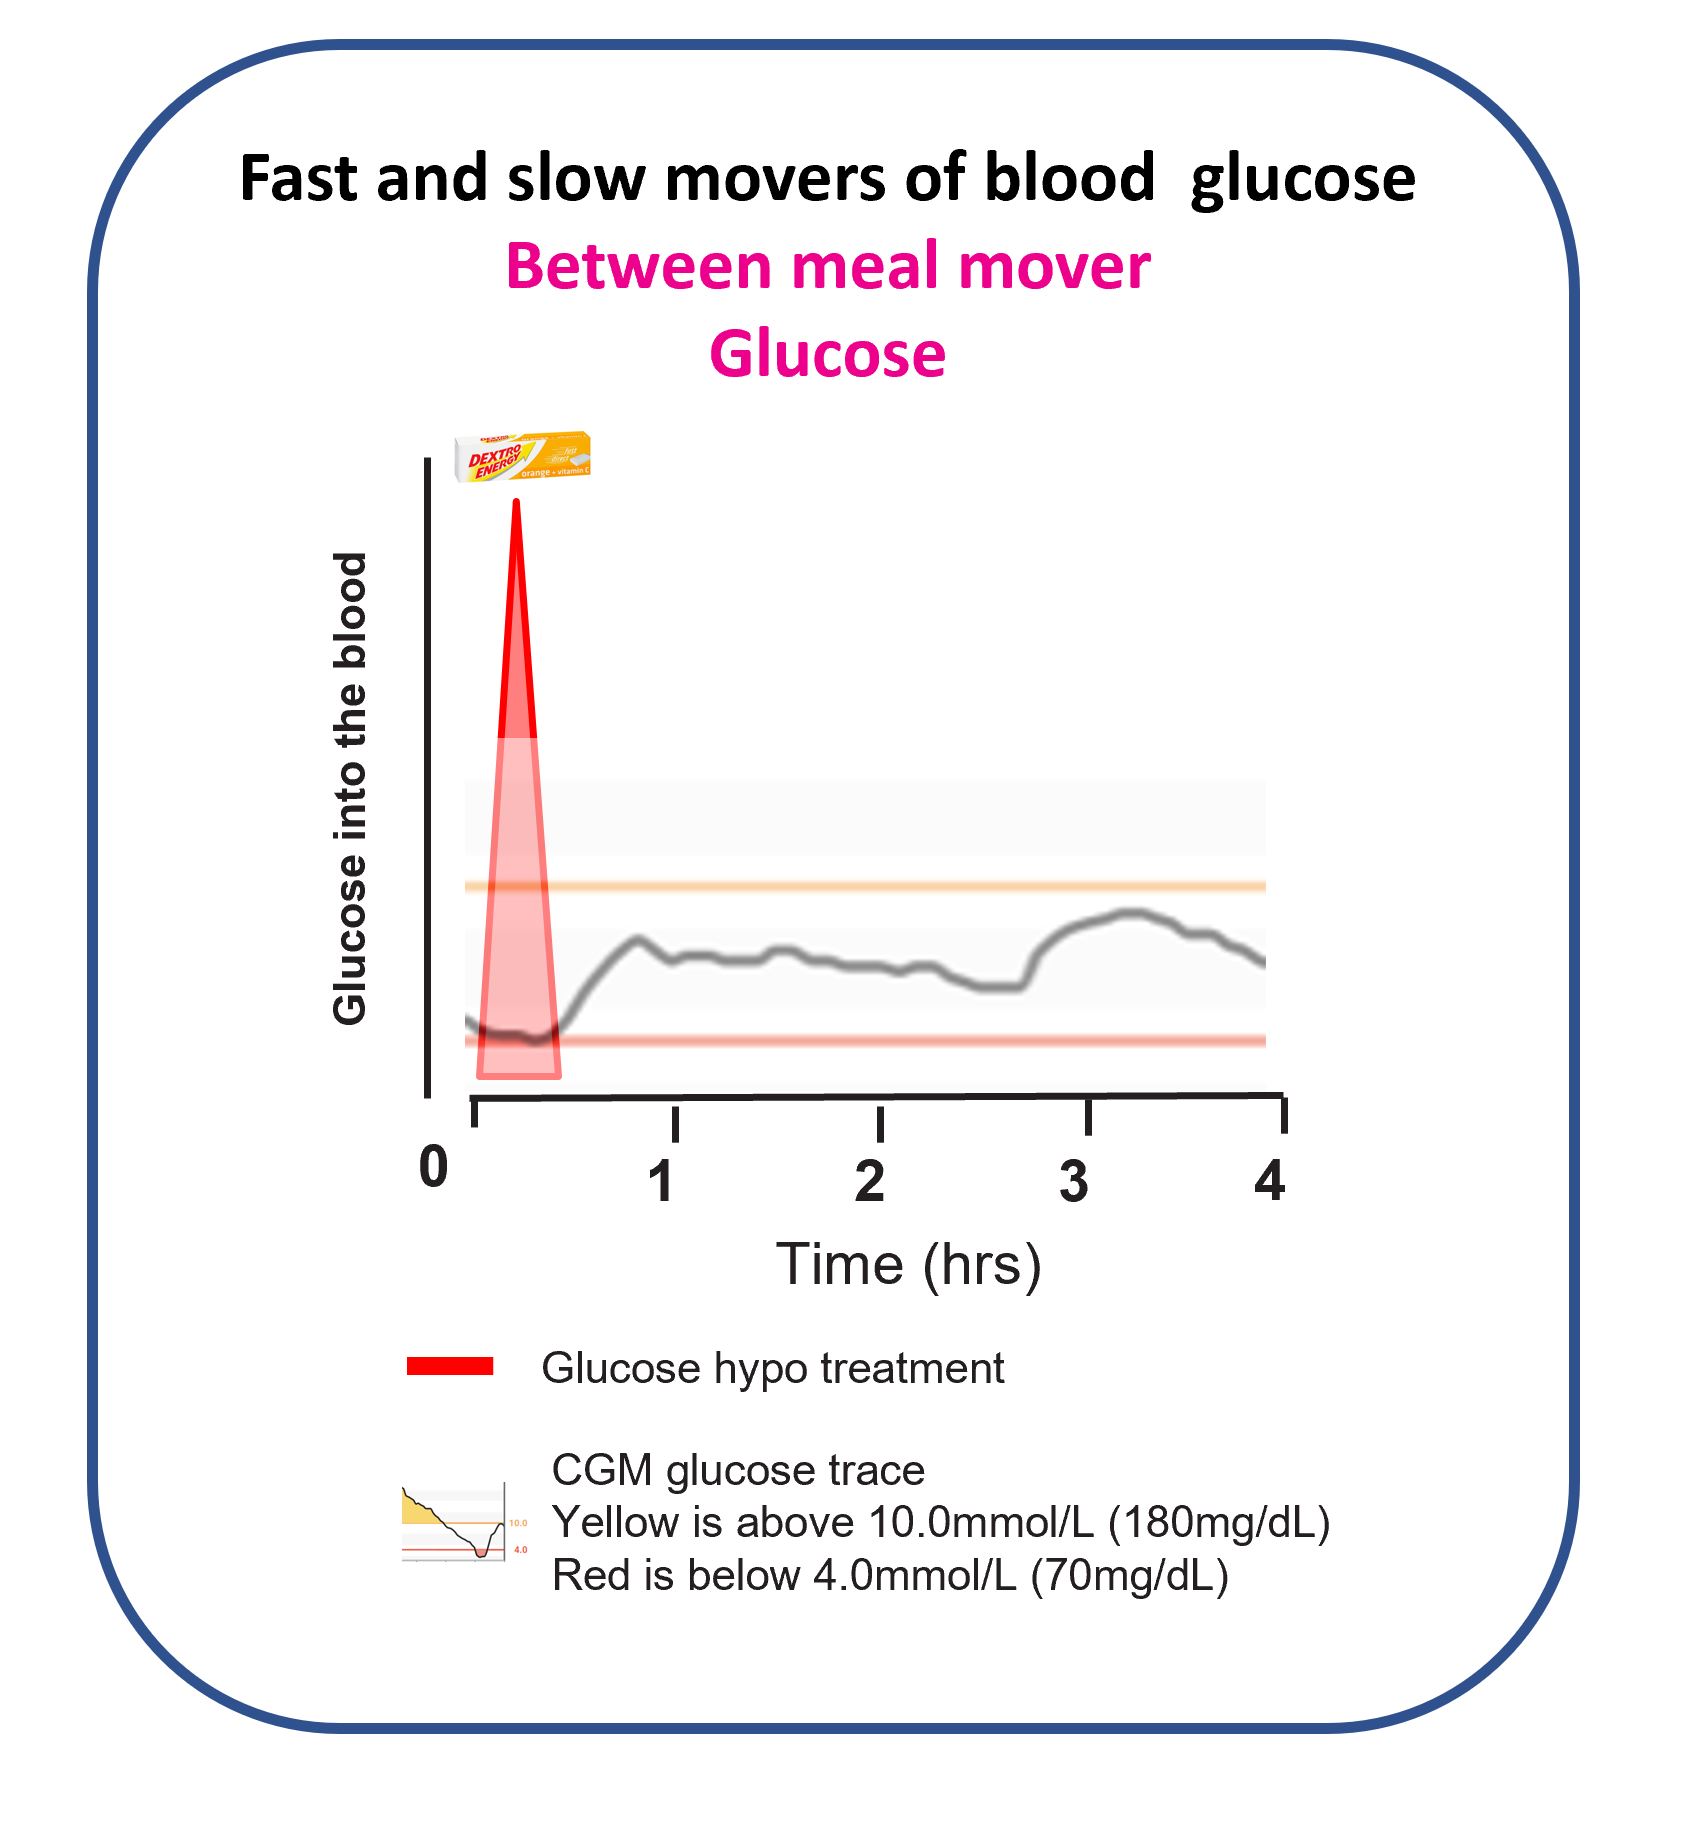
Two principles that inform the MATCH approach:
- The gut maxes out at about 1 gram of glucose absorbed per minute.
- It takes roughly 20 minutes for a treatment to show up clearly on CGM.
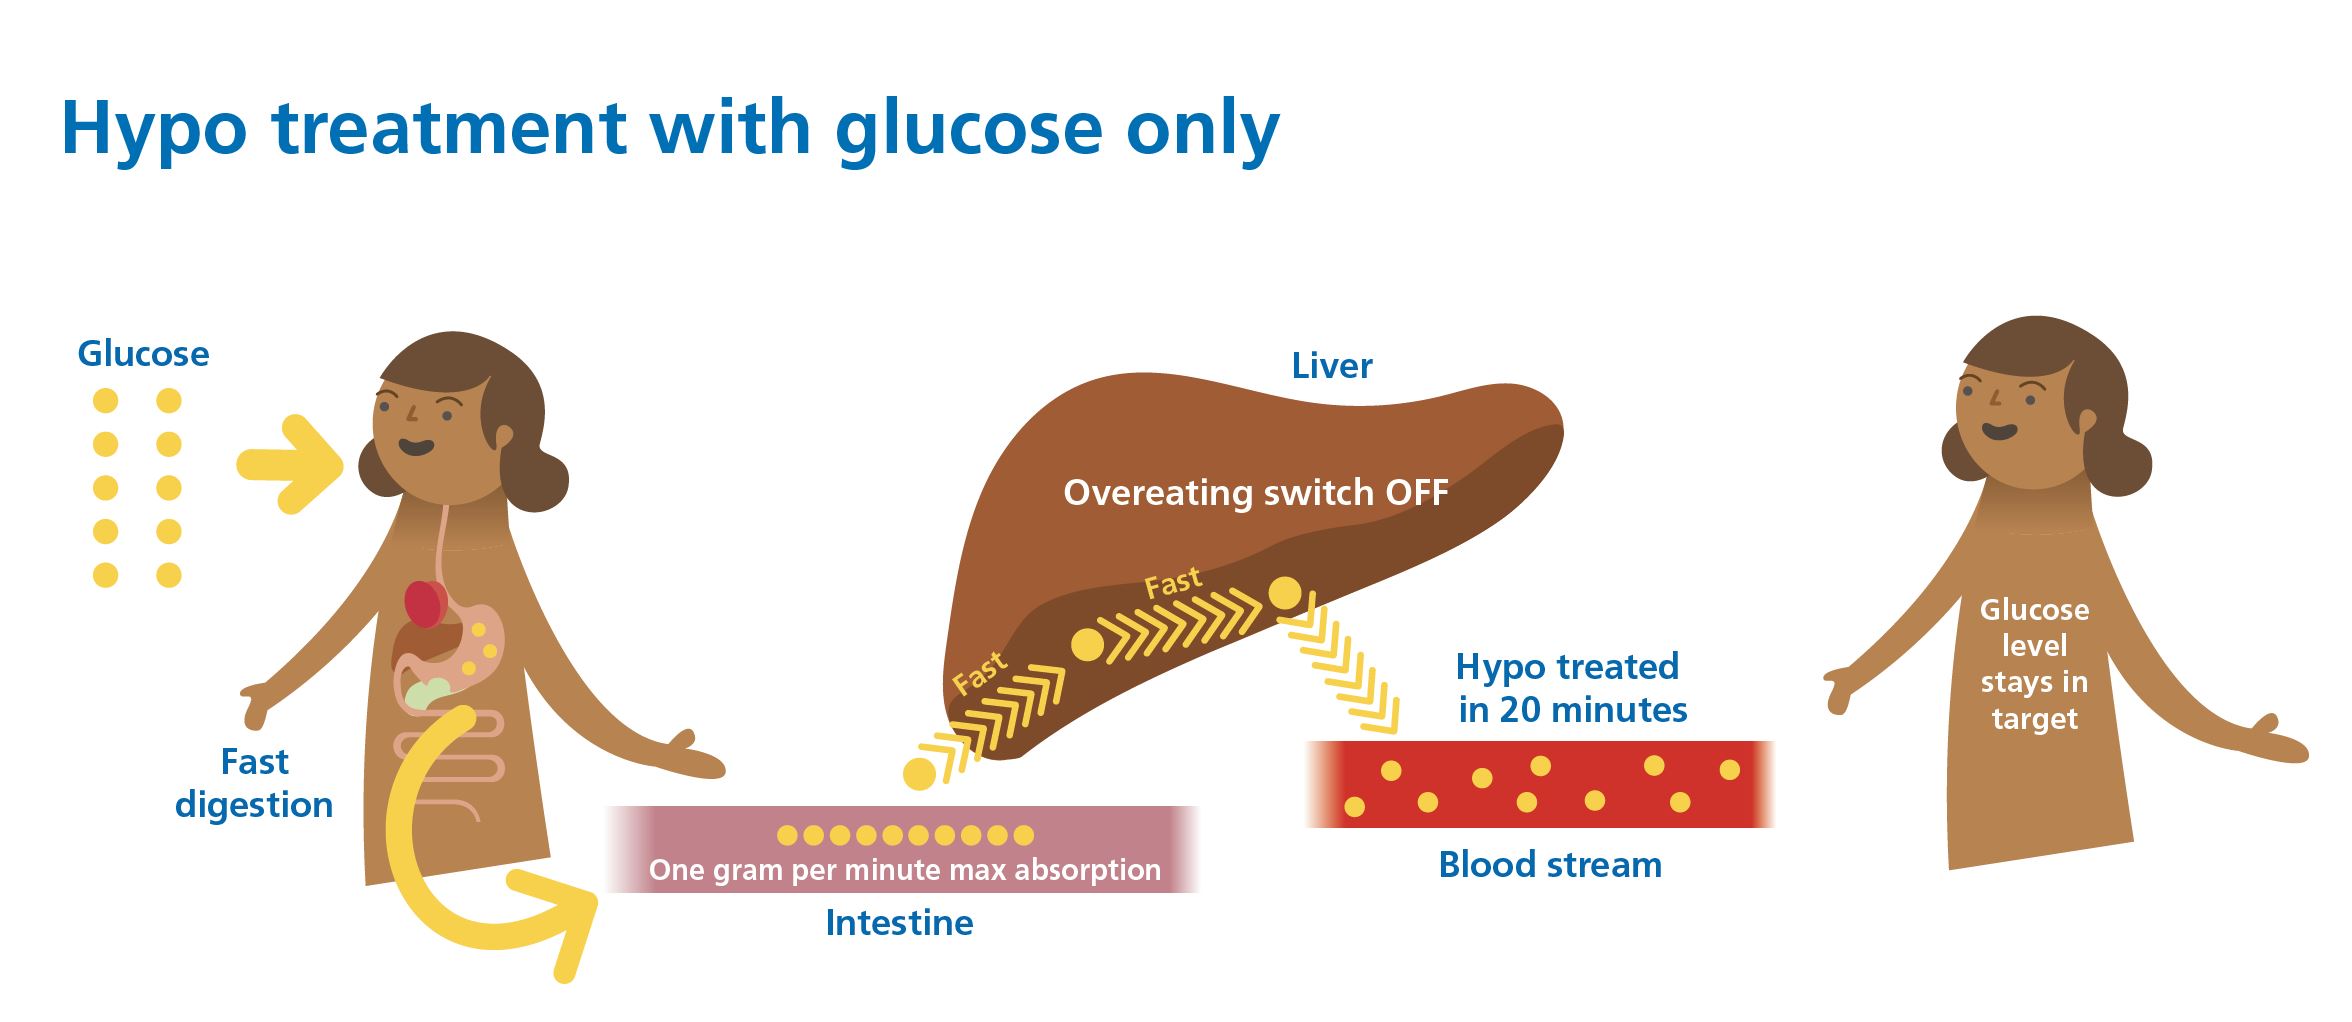
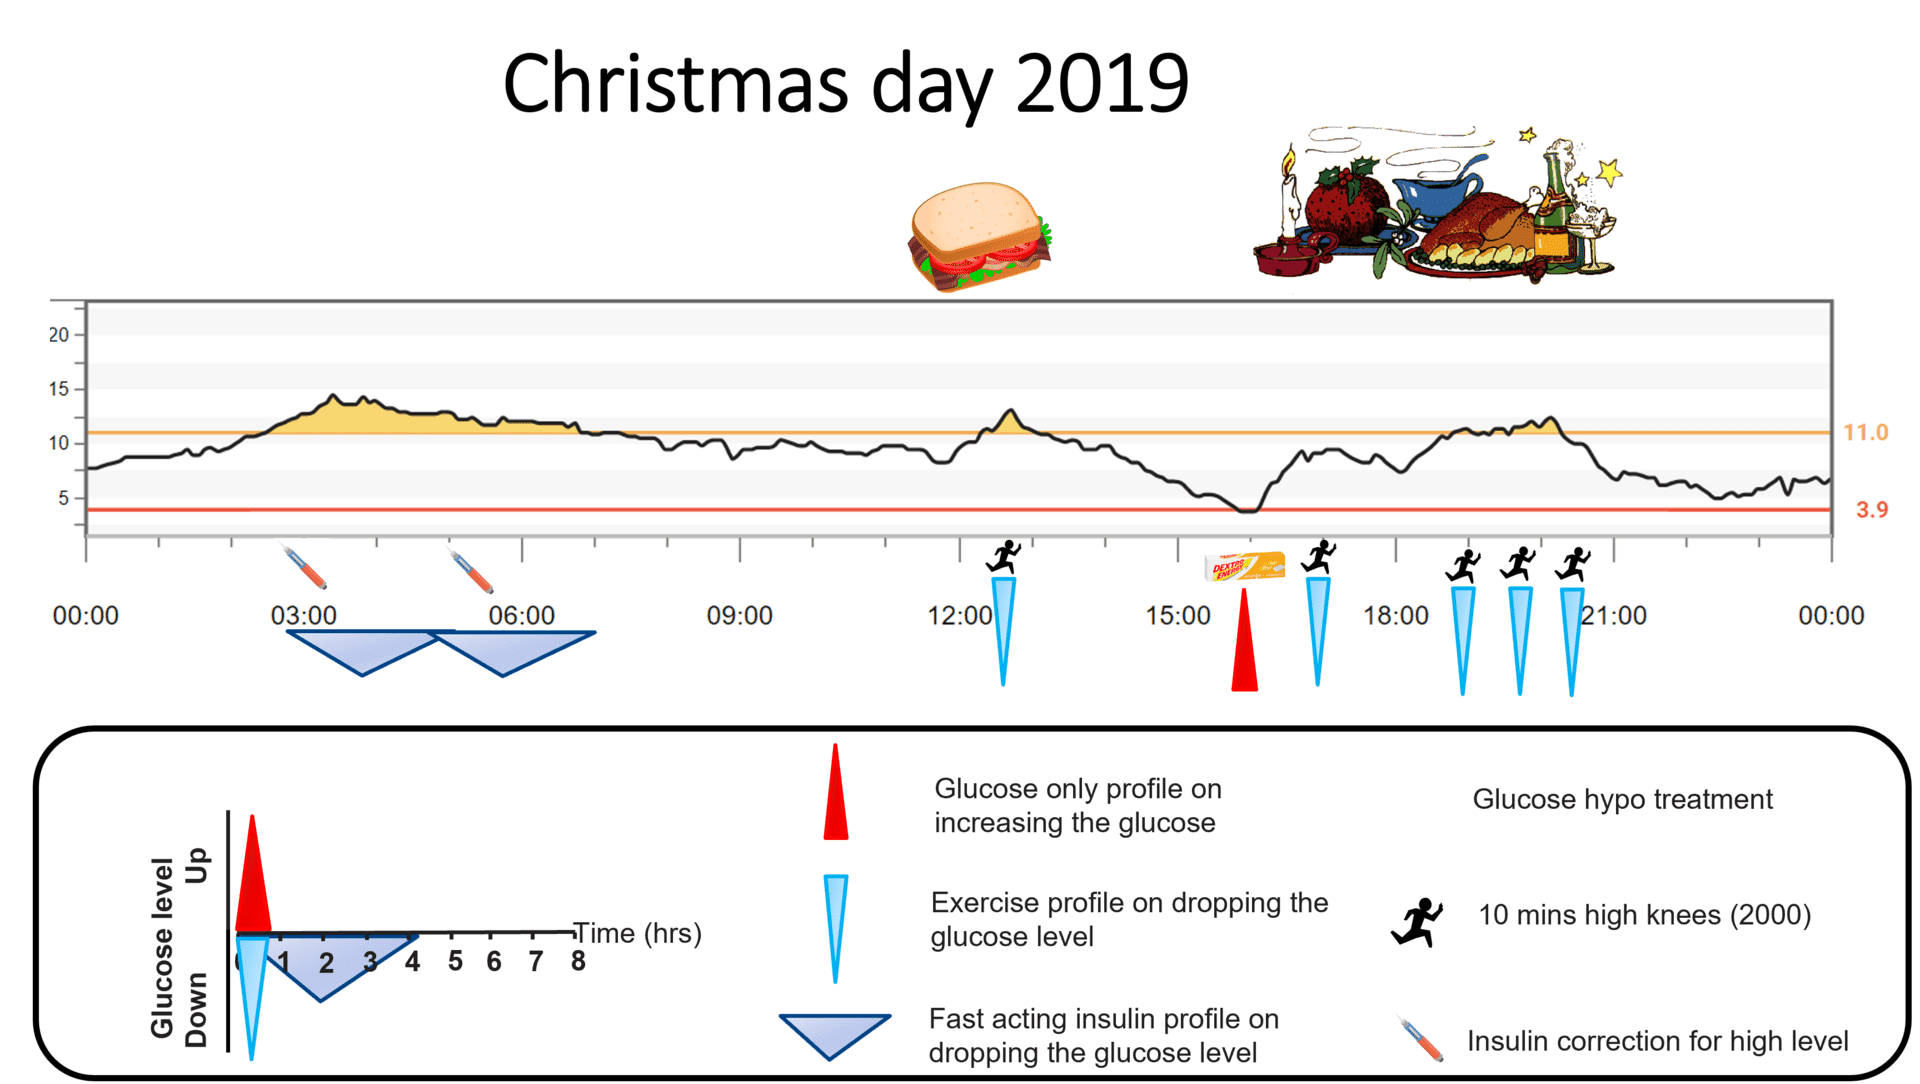
Swapping sugar drinks for dextrose tablets is a change many people find makes hypo management more predictable.
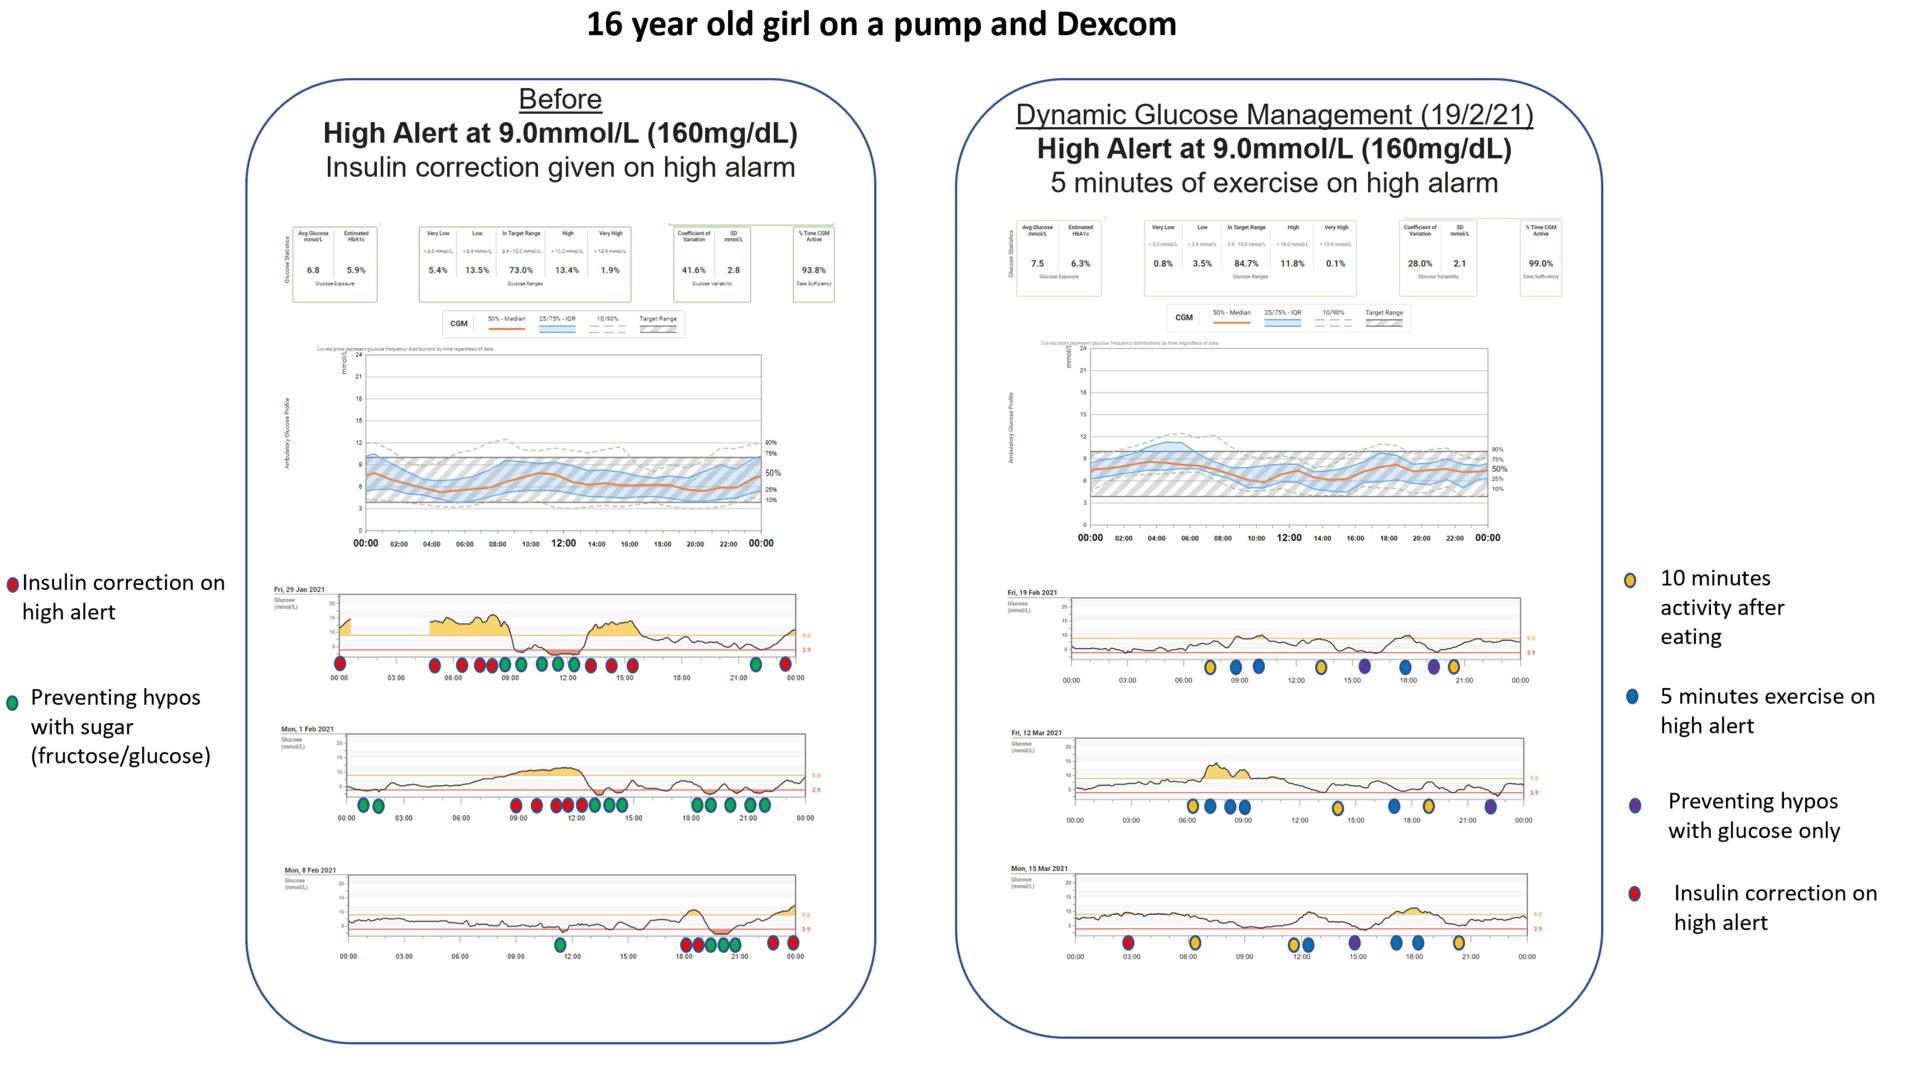
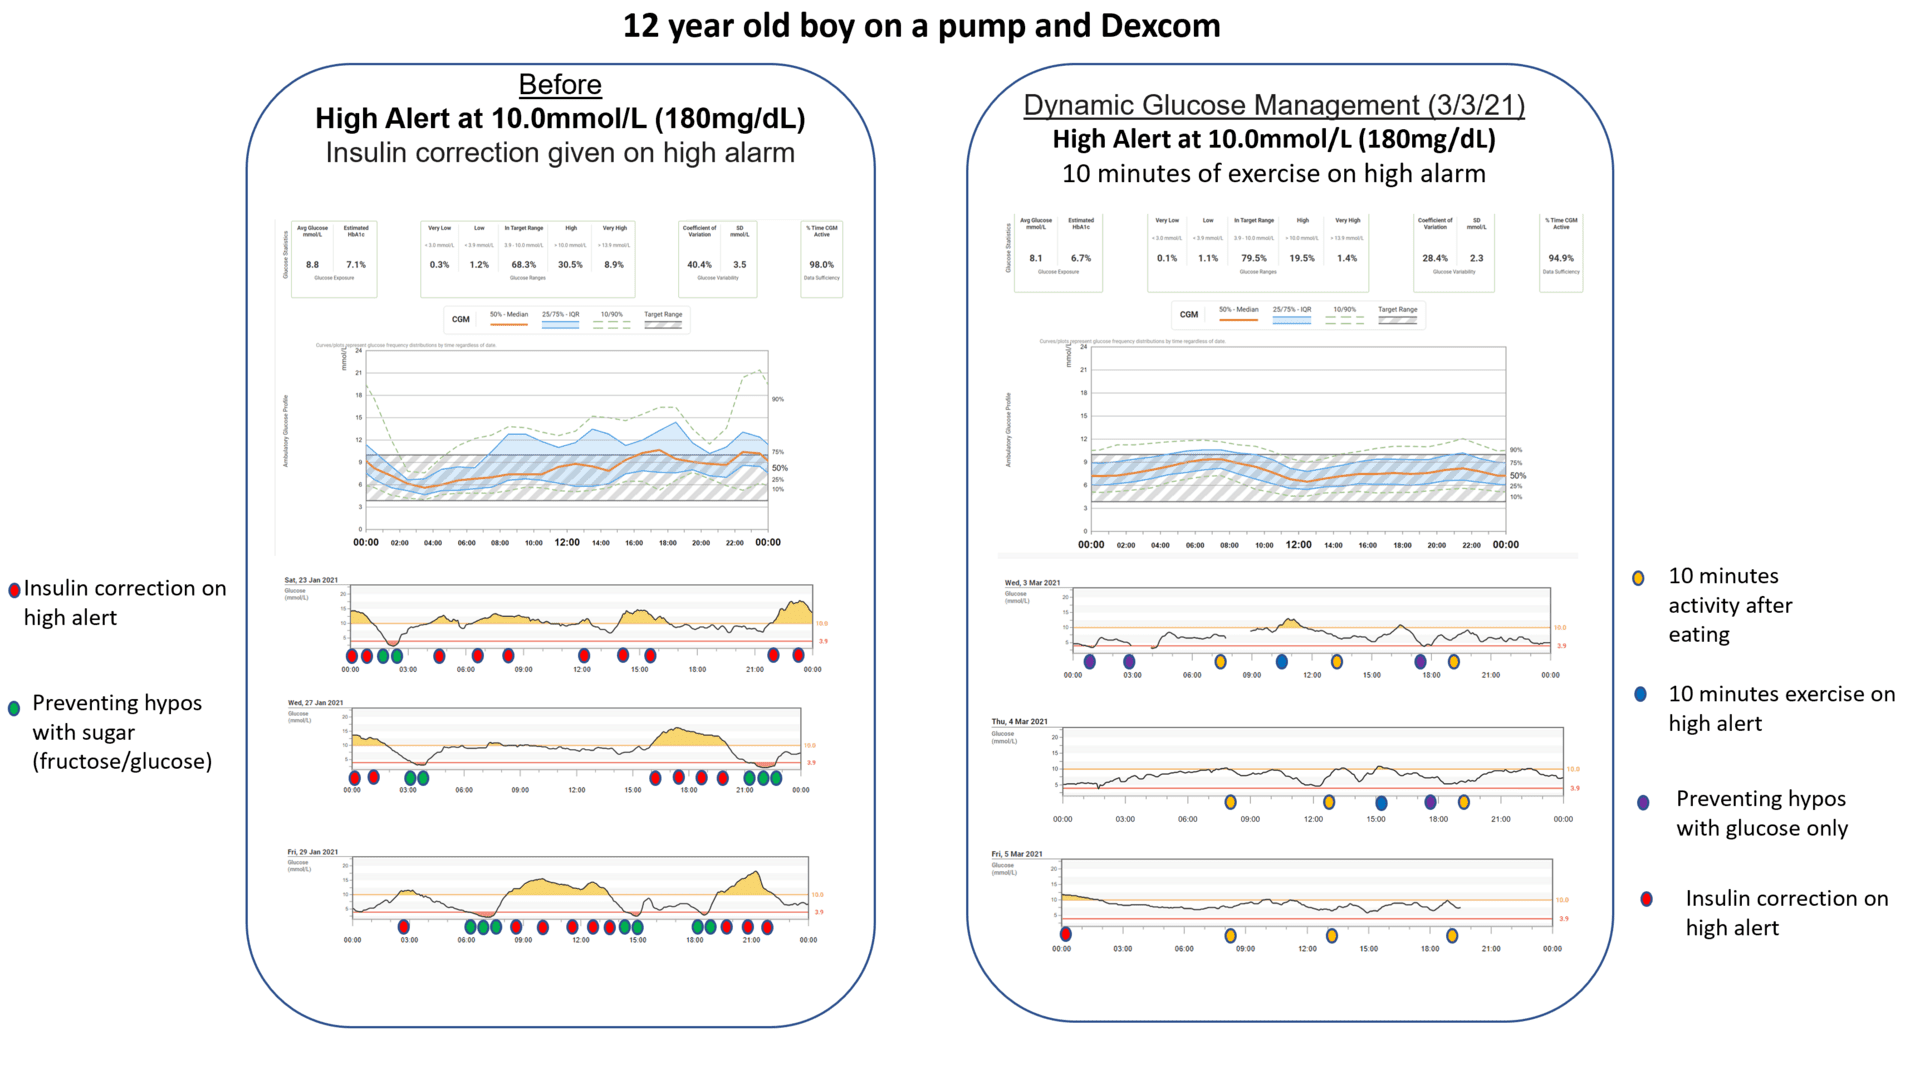
After switching to Dynamic Glucose Management, many people find they stop needing repeat treatments.
Ready to explore MATCH in depth?
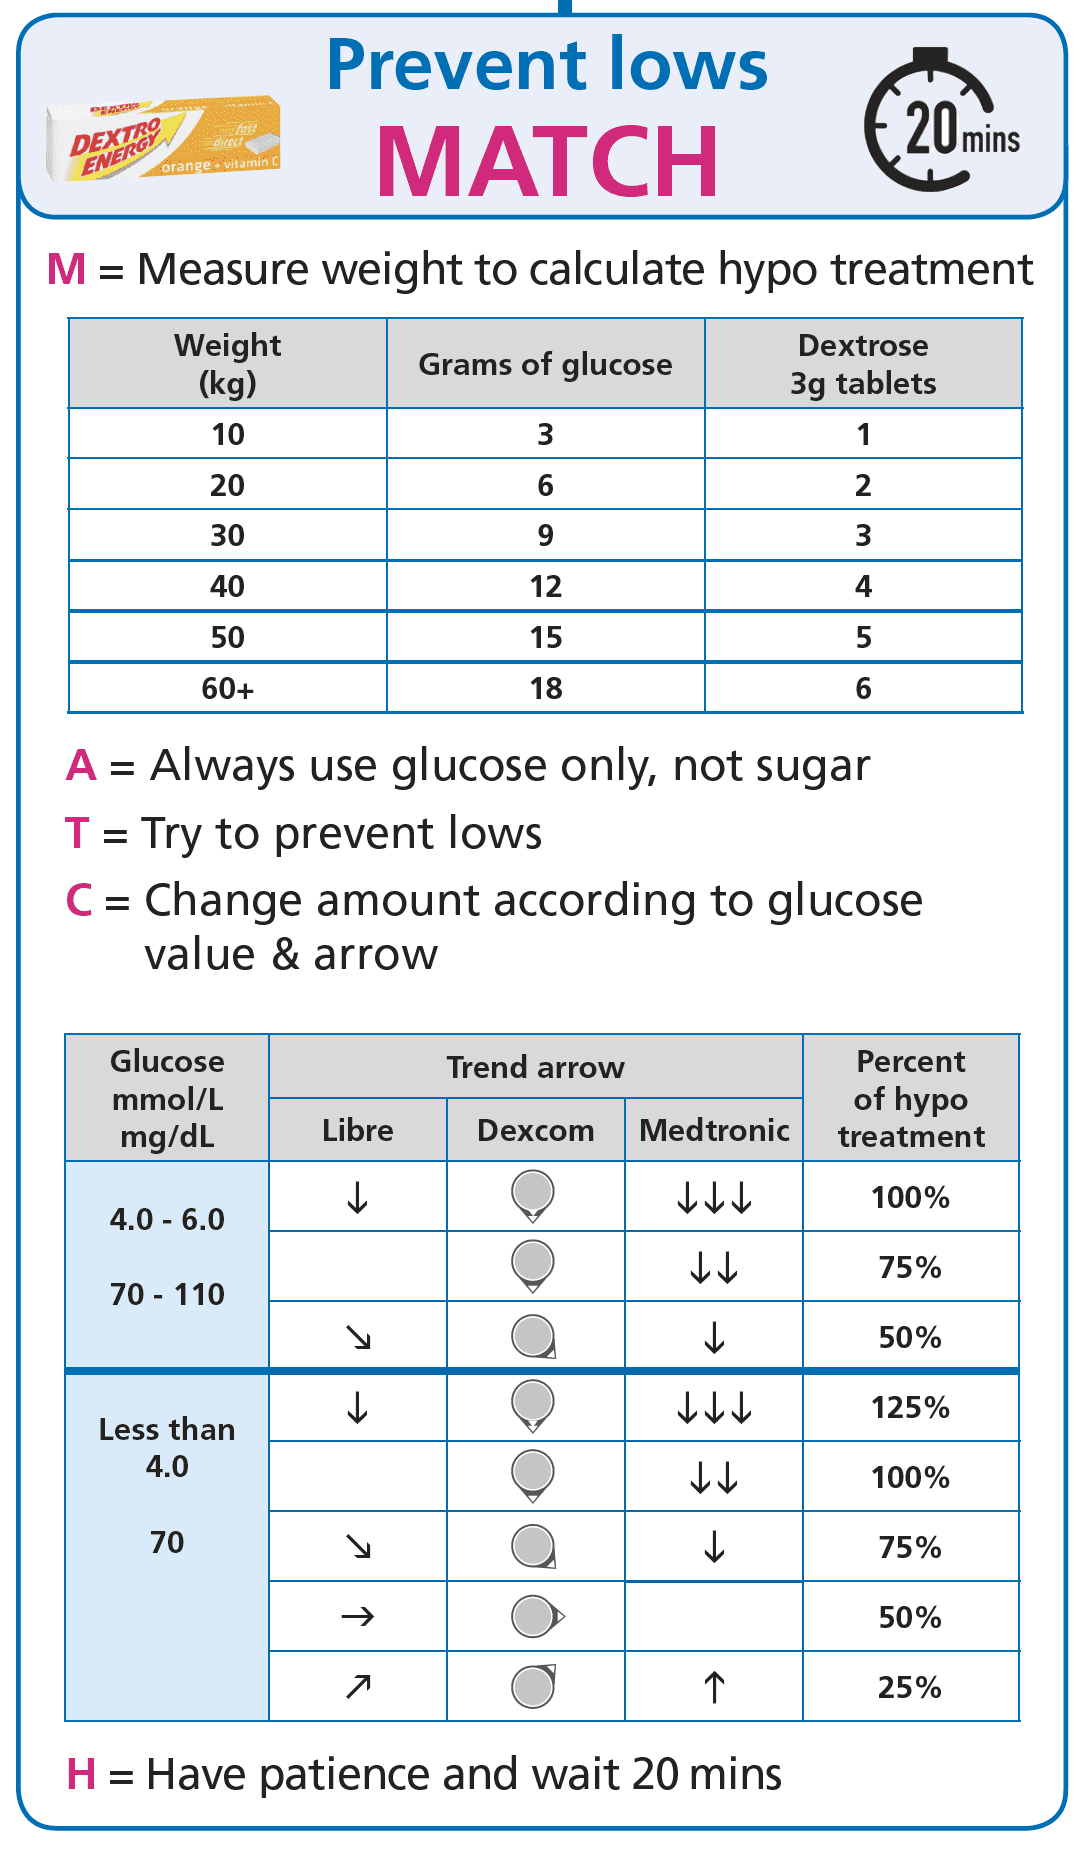
MATCH introduces the idea of scaling the glucose treatment to current glucose level and rate of fall. Not all hypoglycaemic episodes are the same, and they tend not to respond identically to the same amount of glucose.
Scaling hypo treatment by glucose level and rate of fall
Watch: MATCH, scaling hypo treatment by level and rate of fall (YouTube)
How the scaling tends to work in practice
The new idea in MATCH is scaling the glucose amount to current glucose level and rate of fall, rather than treating every hypo with the same fixed amount.
Population-average framing. The amounts below are population-average examples at the stated weight anchor; they are not a personalised dose. Each person living with T1D has their own typical treatment amount, set with their diabetes care team based on weight, current insulin sensitivity, and hypoglycaemia history. Apply your own treatment amount; the figures here are educational.
For example, at a heavier adult weight band, a population-average full treatment is around 18 g of glucose (six dextrose tablets). At a glucose of 5.5 mmol/L (100 mg/dL) that is just starting to drift down, around half of the full amount would be a population-average starting band; at the same level falling rapidly, the full amount would be the population-average band. Your own treatment plan, set with your team, may give a different number.
At a smaller child weight band, a population-average full treatment is around 6 g of glucose (two tablets). At a glucose of 3.5 mmol/L (65 mg/dL) that is just starting to drift down, around three-quarters of the full amount would be a population-average starting band; falling rapidly, the band sits around one-and-a-quarter times the full amount. Paediatric hypo treatment scales with body weight at roughly 0.3 g of glucose per kg per ISPAD Chapter 12, with the team’s individualised plan as the authoritative reference, not this page.
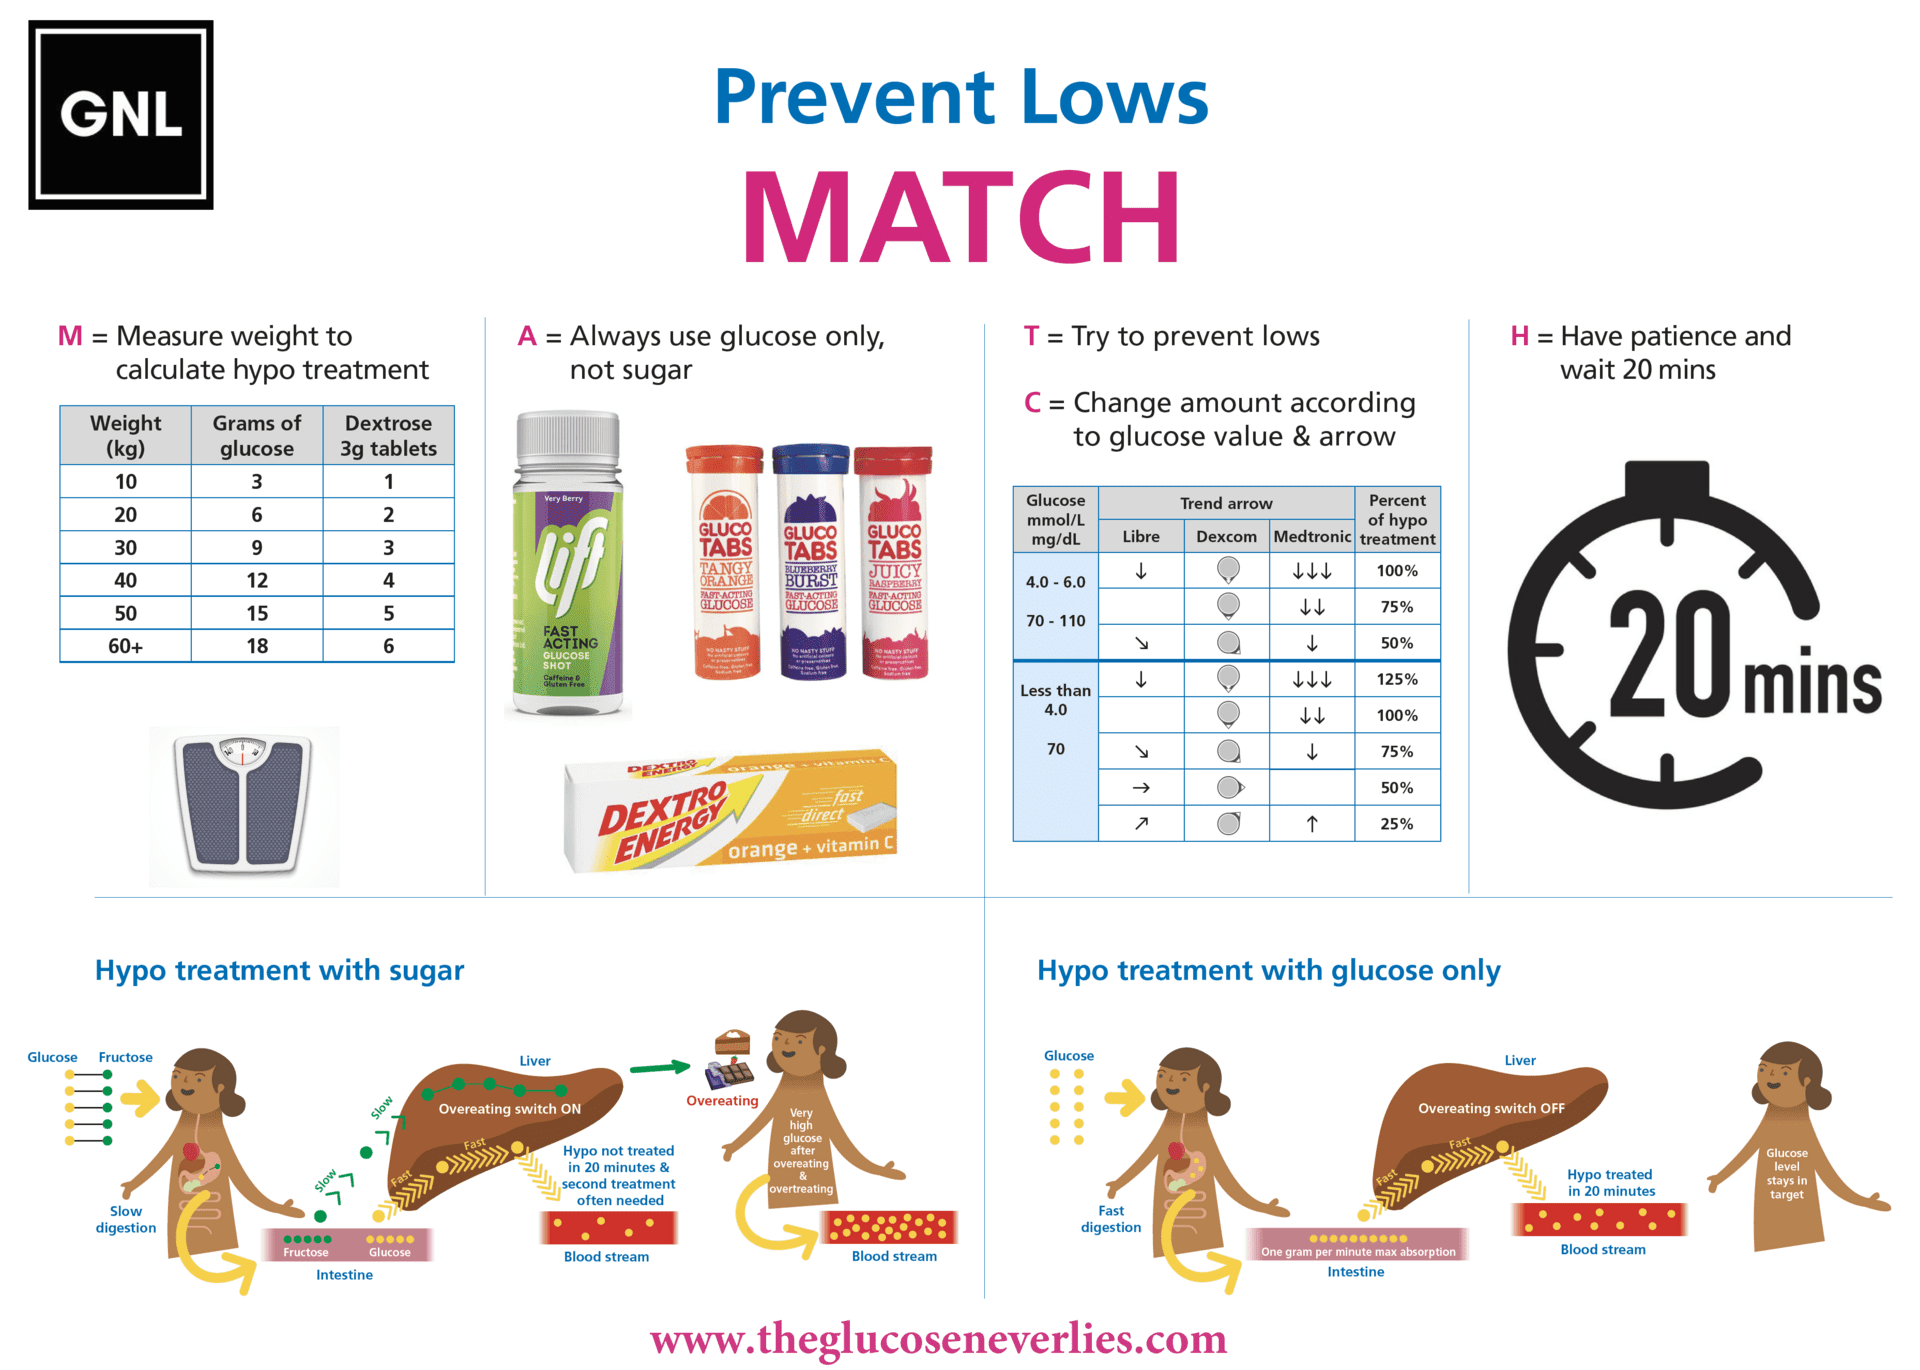
Then comes the hardest part: wait 20 minutes before deciding on a second treatment. That is how long it typically takes for glucose to absorb and register on CGM.
Will this work perfectly every time?
No. The MATCH framework is a solid guide for most people most of the time, but type 1 diabetes is highly individual and every hypoglycaemic episode has a backstory. Factors that can change the response significantly include:
- How much bolus insulin is still circulating
- Activity or exercise in the past 3 hours
- Heat and humidity
- How many hypoglycaemic episodes have occurred in the last 24 hours
- Many other variables that interact in ways that are not always predictable
The skill develops through the feedback loop: dose, wait, read the curve, adjust next time. The Glucose Never Lies.
Exploring MATCH with your CGM data
This content is for educational exploration only. It describes population-average responses and general principles. It is not medical advice and cannot replace individual clinical guidance from your diabetes care team.
Every glucose-treatment amount on this page is a population-average estimate at the stated weight anchor. People living with T1D have their own typical full treatment amount, and their own scaling band by level and rate of fall, set with their diabetes care team based on weight, current insulin sensitivity, and history of hypoglycaemia. Those personal numbers, not the figures on this page, are the authoritative reference for any individual treatment. Discuss any change with your team before applying it.