
Foundations, Part 12
Measuring T1D Success
Open the CGM app and there are dozens of metrics on offer. Tracking too many, too soon, is a reliable route to confusion. This page narrows the field to three measures that are easy to know, easy to revisit, and together explain most of what matters day to day.
Ask Grace
Wondering which numbers are worth tracking and which ones just add noise? Ask Grace.
The three core measures
Measuring everything is a reliable way to manage nothing, except burnout. Three measures are worth focusing on, because together they explain most of what matters and the rest can be revisited later:
- Time in range, percentage of time between 3.9 and 10.0 mmol/L (70 to 180 mg/dL).
- HbA1c, reported as mmol/mol or per cent; a blunt tool, useful when interpreted in context.
- Total daily insulin dose, units per kilogram per day (U/kg); often overlooked, yet it reveals a great deal about physiology and insulin sensitivity.
Blood lipids (ApoB, or non-HDL / LDL cholesterol) and blood pressure matter alongside these and have dedicated GNL guides in development.
1. Time in range (3.9 to 10.0 mmol/L or 70 to 180 mg/dL)
Time in range is a measure you will have encountered throughout the Foundations guide. The international consensus targets are below.
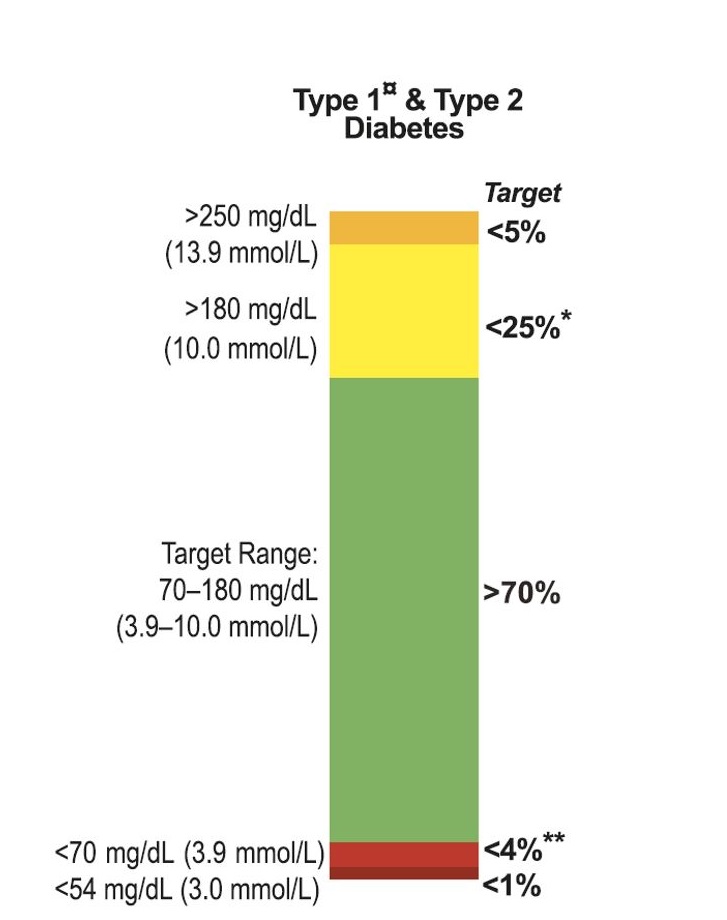
70 per cent time in range is a solid, realistic first milestone. With Dynamic Glucose Management, 70 per cent is the starting point, not the ceiling.
The 70 per cent target is an ensemble figure, not a personal one. It was modelled on average glycators using a small set of CGMs in randomised trials. Two things shift it for an individual: which CGM you wear (calibration zone) and how quickly your biology glycates haemoglobin. The What Gets Measured Gets Managed guide walks through the personalised target as two separate steps; this Foundations page focuses on the ensemble starting point.
The graphic below helps explore what different TIR targets might mean in terms of effort and attention. Worth picking a target that feels genuinely achievable rather than aspirationally unrealistic.
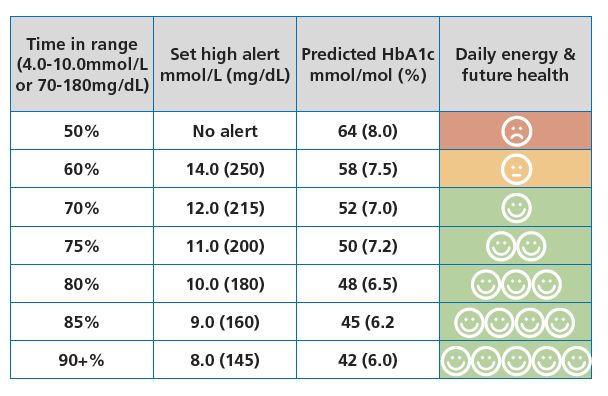
To reach a higher TIR, the high alert threshold needs to be set accordingly, and the GAME strategy for stopping highs becomes important. Improving by around 5 per cent every few weeks tends to be more sustainable than a dramatic overnight change.
2. HbA1c (mmol/mol or per cent)
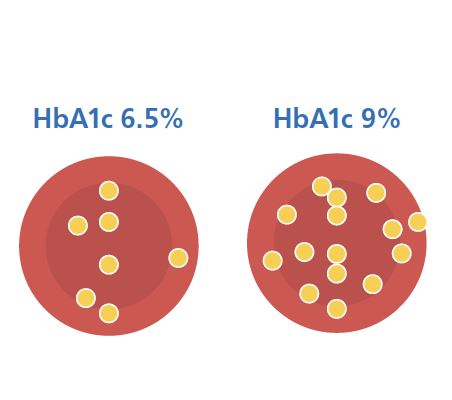
HbA1c measures how much glucose has become attached to red blood cells; higher HbA1c reflects higher average glucose over roughly the last three months.
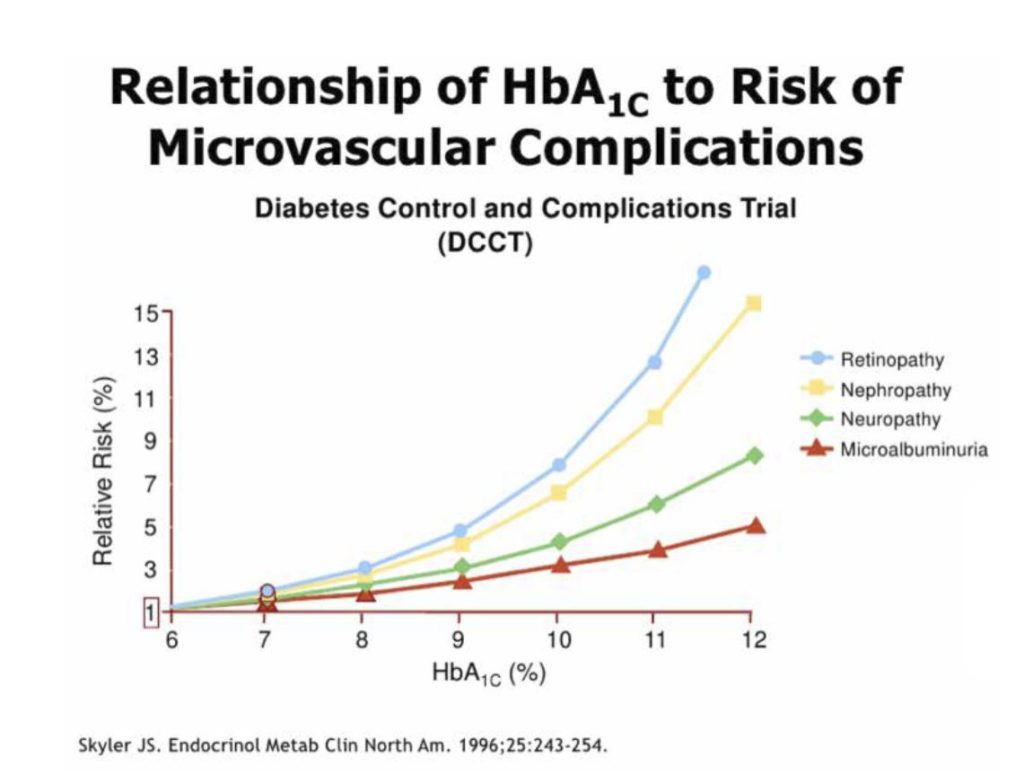
The landmark DCCT trial showed that the risk of microvascular complications tends to rise as HbA1c increases, making HbA1c a useful predictor of long-term risk. It is a blunt tool when used in isolation.
A widely-used headline goal is HbA1c ≤ 48 mmol/mol (6.5 per cent), the ISPAD paediatric target and a common adult clinic-letter goal. Keeping time in range above around 80 per cent makes this very achievable for many people.
HbA1c is not a simple average of glucose. Two people with identical mean glucose can have HbA1c values 10 mmol/mol apart. This is biological variation in how quickly haemoglobin glycates (a stable, trait-like property), not measurement error. The Pemberton-Chalew mHGI framework lets you place yourself as a low, average, or high glycator, and that classification shifts your personalised TIR target. The framework is not yet published: the abstract was presented at the ADA 2026 Scientific Sessions on 7 June 2026 and the manuscript is in preparation. Walk through it in Part 2 of the What Gets Measured Gets Managed guide; your personalised target, taken as two separate steps (your glycator status first, then your CGM zone), sits in Part 4.
Author note. John Pemberton (GNL founder) is first author on the Pemberton, Krone, Uday, Fang and Chalew 2026 mHGI manuscript, currently in preparation, and lead author on Pemberton, Uday, Krone, Fang, Chalew 2025 (BMJ Open Diabetes Research and Care), the ethnicity paper behind the caveat below. Declared so the conflict of interest is visible to the reader.
Caveat: in some people, particularly those with certain haemoglobin variants or darker skin tones, HbA1c can run higher (or lower) than time in range would predict. If this applies to you, HbA1c and ethnicity, why the relationship between HbA1c and glucose isn’t always straightforward is worth reading.
3. Total daily insulin dose (U/kg)
Total daily dose tells you a great deal about insulin sensitivity and underlying resistance. The adult range is broad: roughly 0.4 to 1.0 U/kg, and in some cases up to 2.0 U/kg. A 75 kg adult often uses 30 to 75 units a day; a 60 kg adult often uses 24 to 60 units a day.
Typical adult U/kg distribution
Approximate ranges (drawn from clinical practice and registry data; not a formally published distribution):
- 0.4 to 0.5 U/kg, insulin sensitive (~10 per cent of people with T1D)
- 0.5 to 0.7 U/kg, some insulin resistance (~30 per cent)
- 0.7 to 1.0 U/kg, significant insulin resistance (~50 per cent)
- More than 1.0 U/kg, high insulin resistance (~10 per cent)
Children, paediatric, and adolescent U/kg ranges
In children aged 1 to 12, the same broad distribution applies. During puberty (roughly 12 to 18), insulin needs often rise due to hormonal changes; see the puberty and insulin requirements data:
- 0.4 to 0.6 U/kg, insulin sensitive (~10 per cent)
- 0.6 to 0.8 U/kg, resistance emerging (~30 per cent)
- 0.8 to 1.2 U/kg, significant resistance (~50 per cent)
- More than 1.2 U/kg, high resistance (~10 per cent)
If you find your dose sits in the higher ranges, this is common; around half of people with T1D fall into the significant resistance category. The Insulin resistance in T1D guide covers practical approaches.
The smart play is to improve from where you are now, rather than comparing yourself to the most insulin-sensitive end of the range. If currently above 1.0 U/kg, moving below 1.0 U/kg while maintaining glucose control is a meaningful improvement; if around 0.7 U/kg, getting to 0.6 U/kg while holding glucose steady is serious progress.
Do not sacrifice glucose control just to reduce insulin dose. Lower insulin with higher glucose is not a good trade. Improving insulin sensitivity only matters if you maintain or improve control at the same time. If insulin resistance is your main barrier, Overcoming insulin resistance in T1D covers how to work on it systematically.
This content is for educational exploration only. It describes average responses and general principles. It is not medical advice and cannot replace individual clinical guidance from your diabetes care team.
What Gets Measured Knowledge Check
That was what to track, and what to let go, so measuring never tips into burnout. A short assessment on the guide follows, and 9 out of 10 earns your certificate.
Part 12 of 12, you have completed the Foundations
Measuring T1D Success