
AID systems
The IOB Trade-Off: How Four AID Systems Make Different Bets on Insulin
At the end of a DAFNE refresher session last month, two adults on Control-IQ showed each other their last fortnight’s CGM reports. Both had been on the system over a year. One was sitting at 79% time in range. The other 65%. Same hardware, same algorithm, same insulin. The difference was in how the IOB trade-off had been configured beneath the surface.
Ask Grace
Want to ask which AID system fits your life, or how the IOB trade-off plays out on yours? Ask Grace.
Educational exploration only. Population averages, not personal prescriptions. Not a medical device. Cannot replace individual clinical guidance from your diabetes care team.
The question every AID system must answer
When you take a bolus of rapid-acting insulin, it does not act instantly and it does not disappear on a schedule. It absorbs over minutes. It peaks. It tails off over hours. The shape of that curve varies by dose size, injection site, body temperature, and activity level.
An AID algorithm needs to know, at every five-minute CGM reading, how much of that insulin is still working. If it overestimates, it holds back and glucose stays high. If it underestimates, it stacks more insulin on top of what is already circulating and causes a low.
This is the IOB trade-off. Every system makes a bet about the shape of insulin action, and that bet defines how the system behaves. More responsive configurations model insulin as clearing faster, giving the algorithm more freedom to act, at the cost of showing the person less of what is physiologically circulating.
The core tension: settings that maximise glycaemic control simultaneously minimise the transparency of the variable you most need to see before exercise. This is not a flaw, it is an engineered design choice. Understanding it is the foundation of safe AID optimisation.
What the real-world data shows: a configuration gap, not a system gap
The IOB trade-off is not theoretical. Real-world registry data from more than 190,000 AID users makes the configuration gap concrete.
| System | Registry size | Population mean TIR | Optimal-settings users | TIR on optimal settings |
|---|---|---|---|---|
| MiniMed 780G | 101,629 users | 72.3% | 6.4% (6,531 users) | 78.8%, TBR 2.2% |
| Control-IQ | 20,764 users | ~67% | 67% had CF weaker than guideline | Top CF quartile: 79.1% vs 65.0% (14pp gap) |
| Omnipod 5 | 69,902 users | 64.2% | 53.8% on lowest target, but only 36.7% achieving ≥70% TIR | Lowest target: 68.8% vs ≥7.2 mmol/L: 53.6% |
| UK open-source AID | Real-world cohort | 60% | Below 70% consensus target | Liarakos et al. 2025 DTT |
The 14 percentage point TIR difference between the strongest and weakest correction factor quartiles in Control-IQ users, with negligible change in hypoglycaemia, is among the largest real-world evidence bases for the impact of a single setting change on glycaemic outcomes.
It is safe to close the gap
In a clinical cohort of 91 780G users, only 5.5% were using AIT 2 hours at baseline, despite 81.3% already using the lowest glucose target. When the remaining users were transitioned to AIT 2 hours (Bassi et al. 2025):
- TIR improved from 71.9% to 75.0% (+3 percentage points)
- Time in tight range improved from 47.2% to 50.9% (+3.7 points)
- No increase in hypoglycaemia
- The mechanism was redistribution: automated corrections increased from 0.14 to 0.18 U/kg/day while total daily insulin remained stable
AIT reduction redistributes how insulin is delivered, not how much. The insulin budget stays constant; the algorithm uses it more intelligently.
The IOB visibility gap: what the device shows vs what is circulating
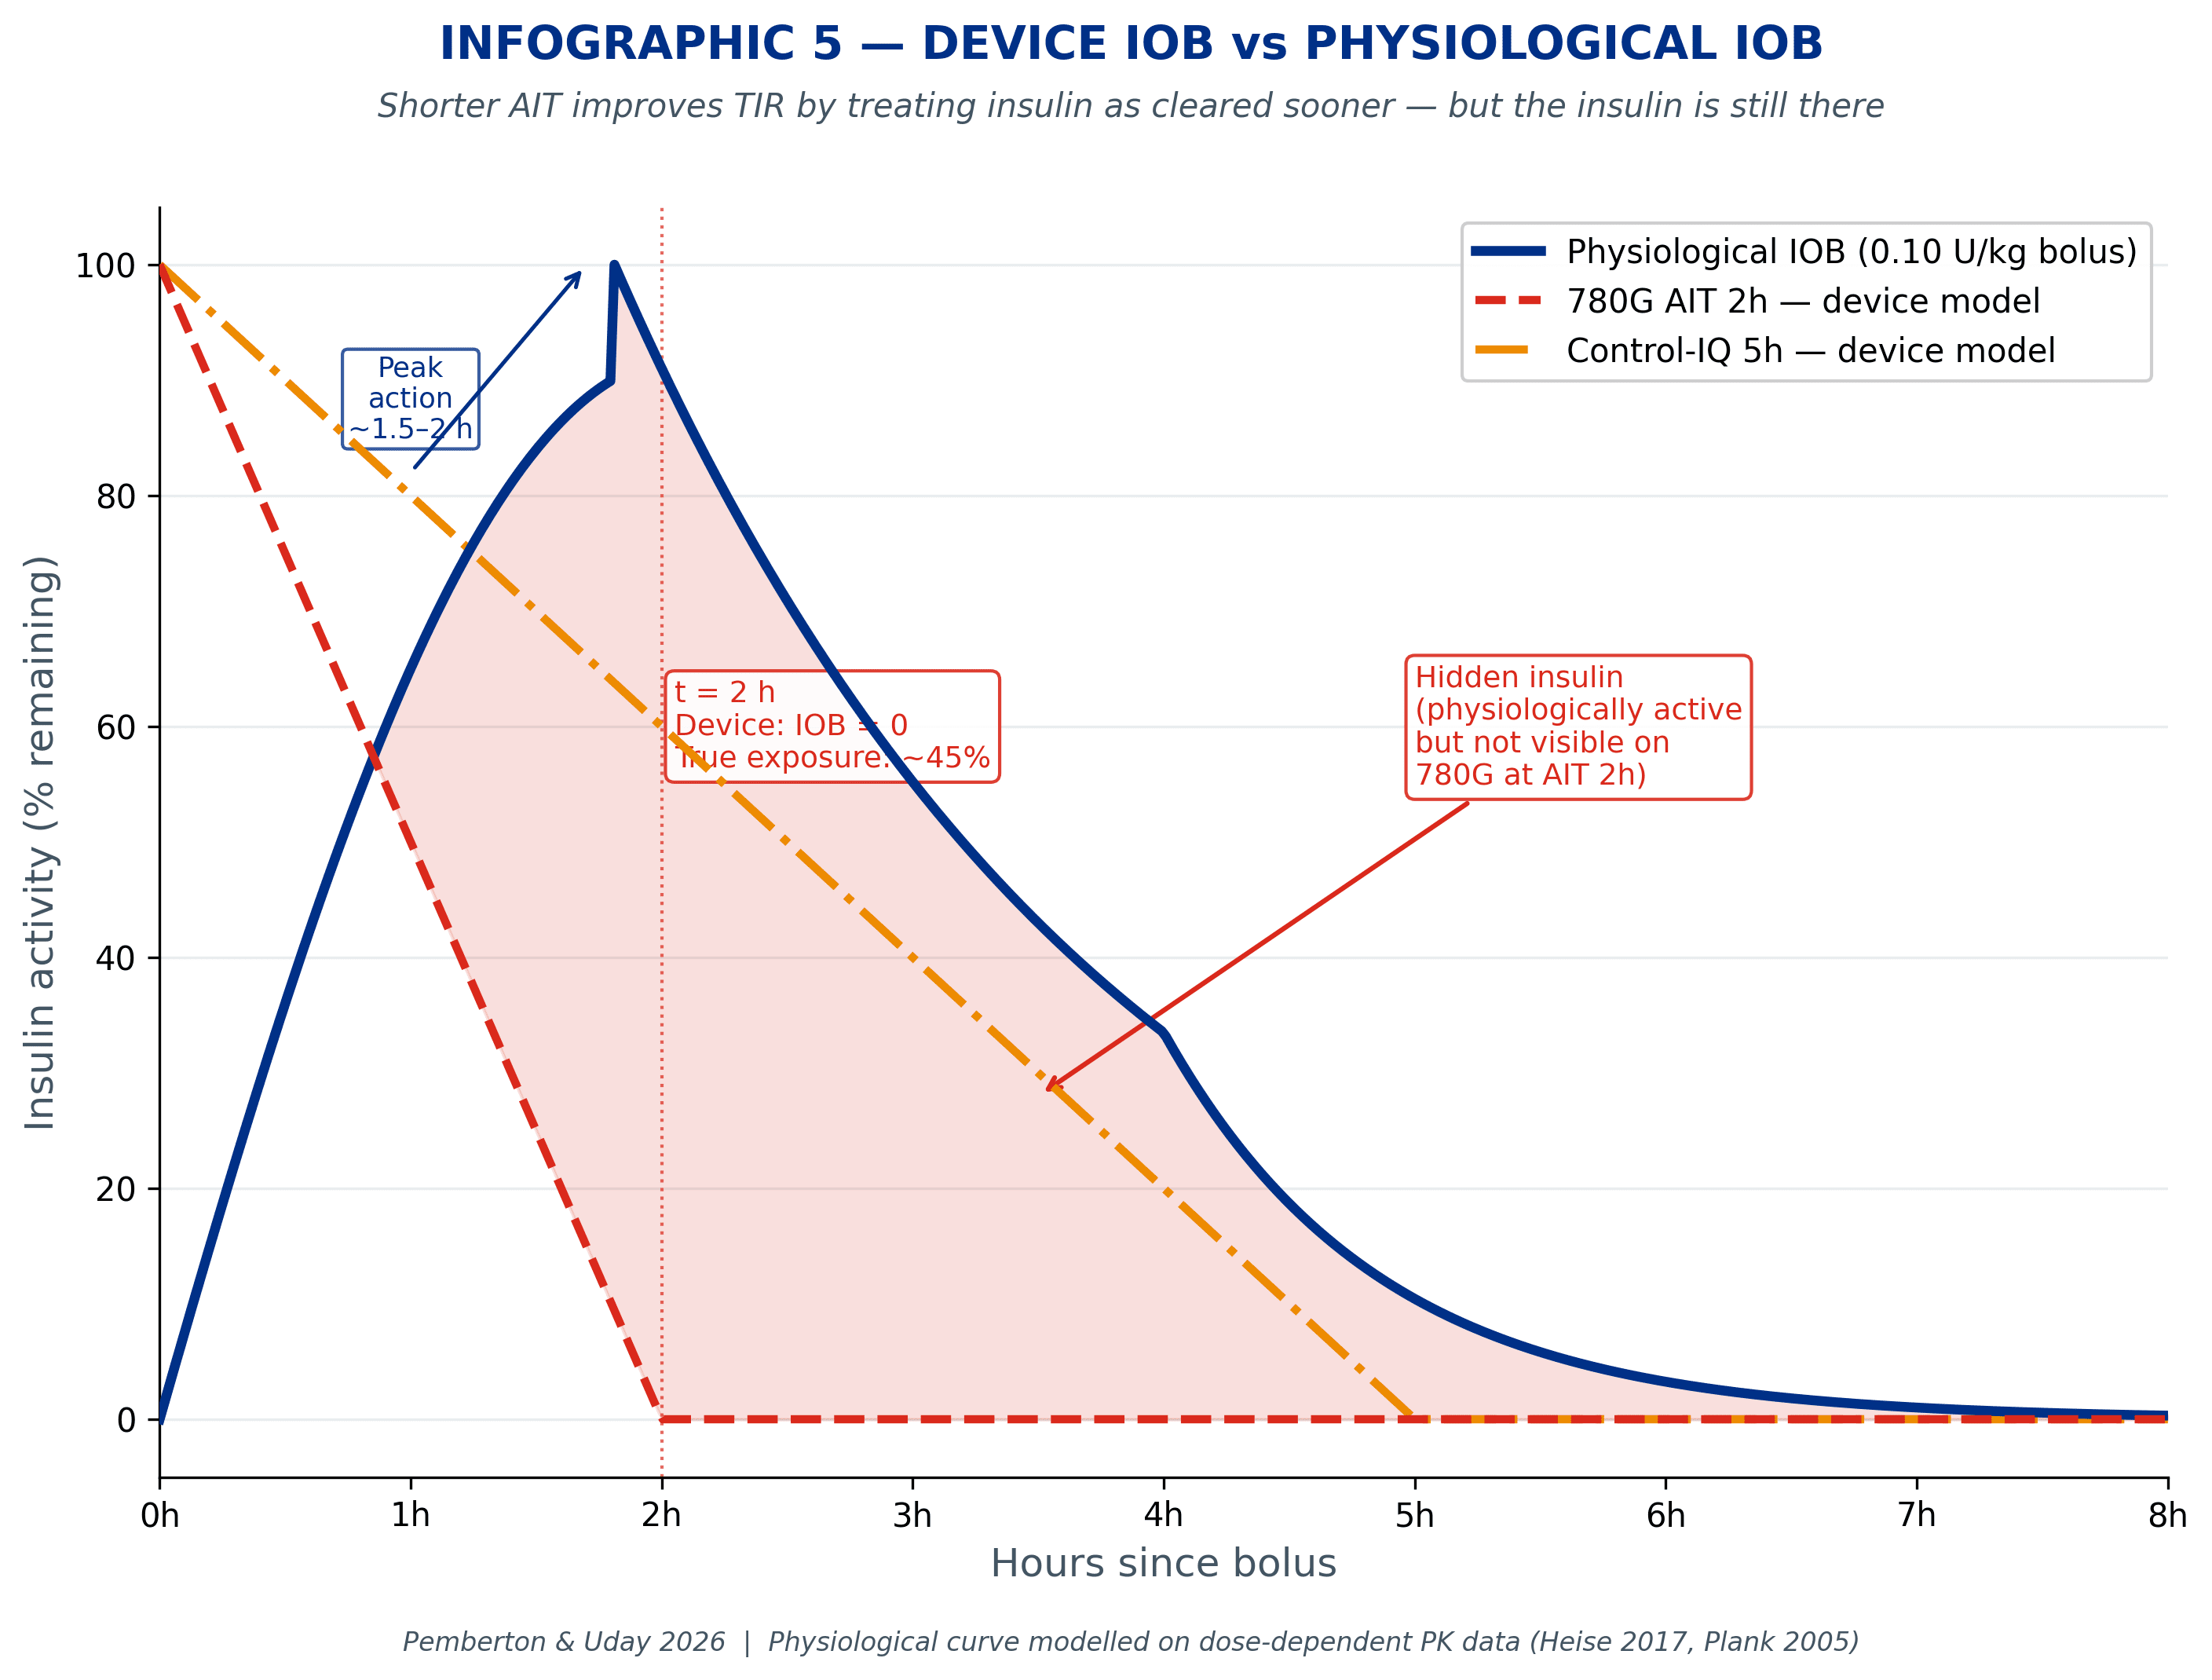
For a 0.1 U/kg meal dose (7 units for a 70 kg person), the chart below shows what AIT 2h and AIT 3h register as remaining IOB compared with what the body is actually doing.
At AIT 2h, the device shows zero IOB from the two-hour mark; physiologically, approximately 2.8 to 3.0 units is still working, around 5.5 to 6.0 mmol/L (100 to 110 mg/dL) of glucose-lowering potential. The algorithm stopped counting almost an hour before the insulin finished.
Four systems, four different bets
Control-IQ: correction factor as the primary lever, and the most transparent IOB model
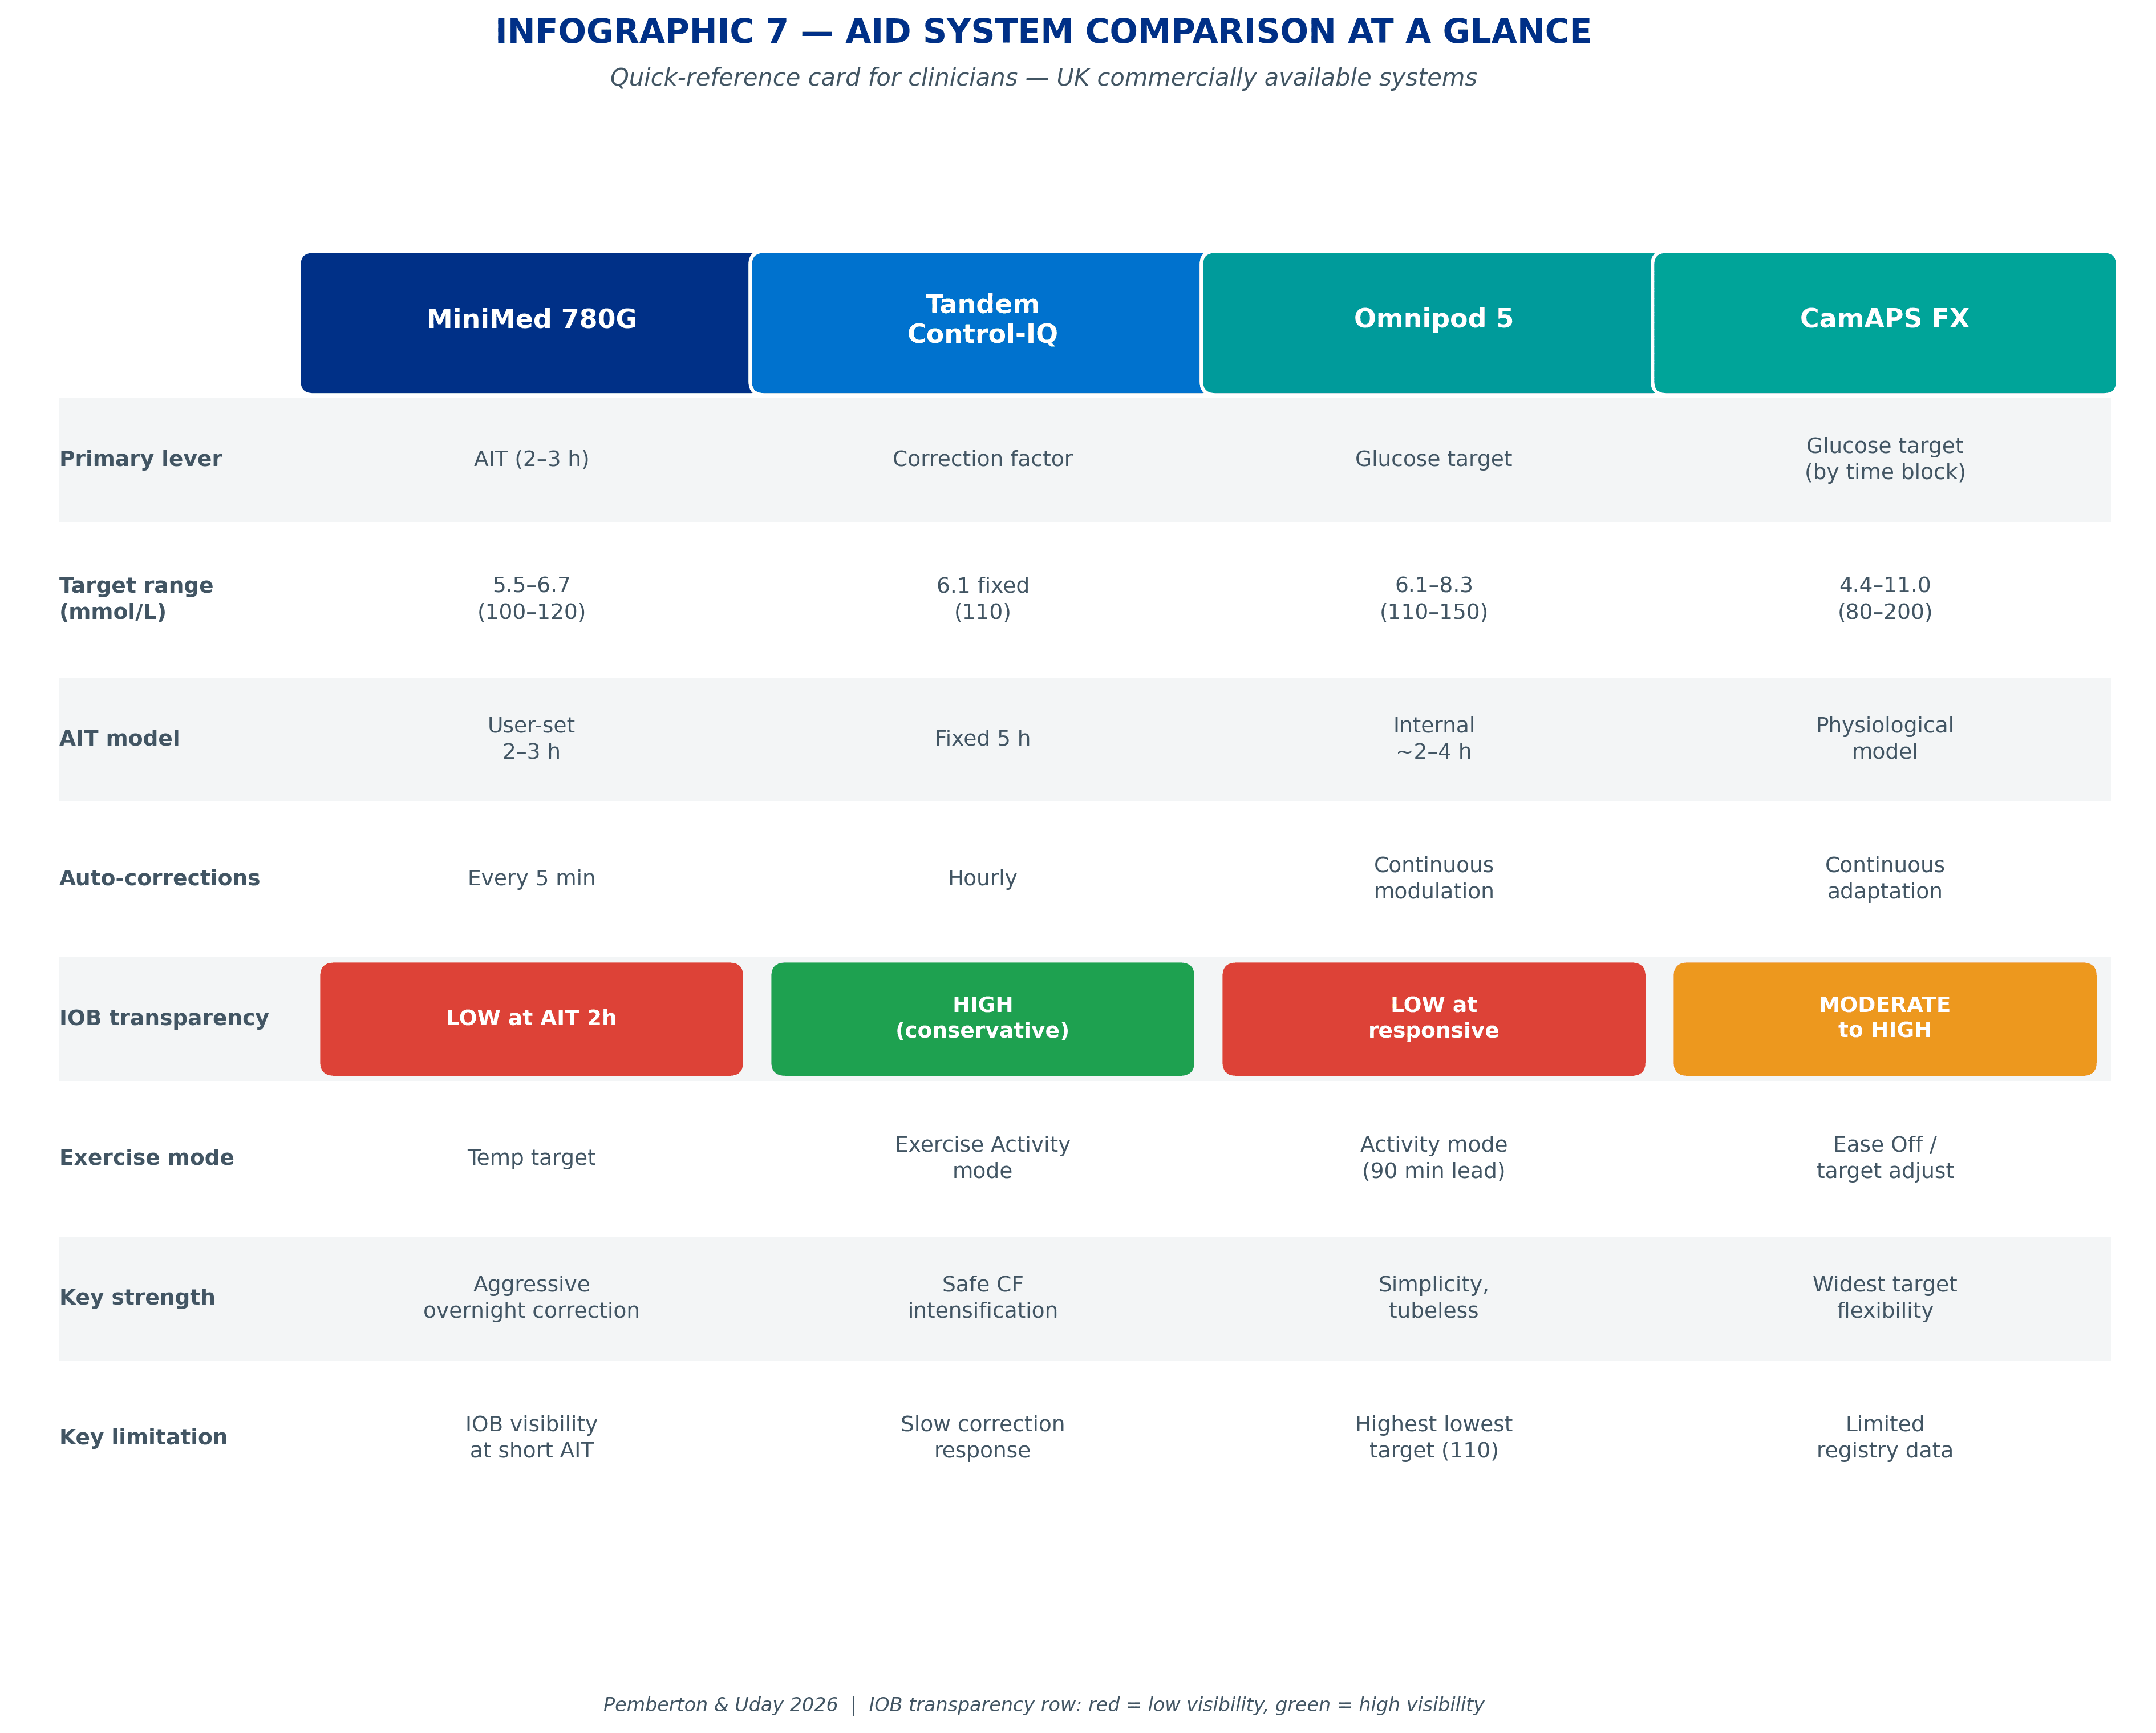
Control-IQ has a fixed AIT of 5 hours and a fixed glucose target of 6.1 mmol/L (110 mg/dL), neither is user-adjustable. The primary responsiveness lever is the correction factor (CF). The algorithm delivers automated correction boluses hourly when glucose is predicted to exceed 10.0 mmol/L within 30 minutes, at 60% of the calculated correction dose. CF governs how much each of those corrections delivers.
In a real-world analysis of 20,764 Control-IQ users, 67% had CFs weaker than the 1700/TDD guideline. The TIR difference between the strongest and weakest CF quartile was 14 percentage points (79.1% vs 65.0%) with negligible change in hypoglycaemia. CF is the most consequential single lever on this system.
The IOB story, a transparency advantage: the fixed 5-hour AIT means the IOB model is more conservative than systems using AIT 2h. At moderate doses, the 5-hour model more closely approximates physiological insulin duration, and may even overestimate residual action for small doses. This reduces the hidden IOB risk seen on shorter-AIT systems. What you see on Control-IQ is closer to what is physiologically present than on AIT 2h systems.
The primary exercise consideration on Control-IQ is not IOB underestimation but negative IOB: when the algorithm has delivered less than the programmed rate, the display can suggest very low circulating insulin while a recent meal bolus may still be substantially active. Negative IOB does not cancel meal insulin.
MiniMed 780G: AIT as the responsiveness dial
The 780G’s primary responsiveness lever is AIT. Reducing it from 3h to 2h means that at any point more than two hours after a bolus, the device registers zero IOB. The algorithm delivers automated corrections every 5 minutes when glucose exceeds the target, the most frequent correction delivery of any of the four systems.
A lower glucose target (5.6 mmol/L / 100 mg/dL rather than 6.7 mmol/L / 120 mg/dL) compounds this: the algorithm acts earlier and more often. Both meal and correction insulin count toward the same IOB pool.
The IOB story: at AIT 2h, device IOB shows zero from the 2-hour mark onward while approximately 40 to 45% of a typical meal dose is still physiologically active. This is the widest hidden IOB gap of any of the four systems. Before exercise, the four-hour heuristic, not the device display, is the reliable safety signal.
The Bassi et al. 2025 data confirms the transition is safe: moving from AIT 3h to AIT 2h in users already on the lowest target produced 3pp TIR gain, 3.7pp tight-range gain, and no increase in hypoglycaemia. The algorithm redistributes when it delivers corrections, it does not deliver more total insulin.
CamAPS FX: algorithm insulin is invisible, and that changes everything
CamAPS FX has a structural IOB rule that makes its responsiveness mechanism distinct from the other three systems. According to the EASD/ISPAD 2025 position statement on AID and exercise: only bolus insulin entered via the bolus calculator counts towards IOB (displayed as Active Insulin). Algorithm-directed delivery does not count.
The carb ratio (ICR) is the lever that directly controls how much bolus IOB accumulates, and therefore how much headroom the algorithm has. For a 60g carbohydrate meal: with a stronger ICR of 1:15 (1U per 15g), 4.0 units enter the bolus IOB pool; with a weaker ICR of 1:25 (1U per 25g), only 2.4 units do. The algorithm sees less IOB and has more freedom to deliver its own corrections, the proportion of insulin delivered algorithmically rises as a direct result. Strengthen the ICR too much, and the bolus IOB brake throttles the algorithm’s ability to manage highs autonomously.
The IOB story: CamAPS’s overall IOB model is more physiologically accurate than shorter-AIT systems for the insulin it does track. But the exclusion of algorithm delivery from the display means the portrait-mode Active Insulin screen can substantially understate total circulating insulin at high responsiveness levels. Rotating to landscape view reveals the algorithm’s full delivery history, a considerably more complete picture. Activate Ease Off mode 90 minutes before planned activity.
Omnipod 5: target-driven AIT, the same gap, internally managed
Omnipod 5 uses AIT in a similar way to the 780G, but AIT is not directly user-adjustable. The algorithm selects an internal AIT (estimated range 2 to 4 hours) based on the chosen glucose target. A lower, more responsive target drives a shorter effective AIT, creating the same physiological IOB gap seen in the 780G at AIT 2h.
At the lowest target (6.1 mmol/L / 110 mg/dL), median TIR in the Omnipod 5 registry was 68.8%, and only 36.7% of the 69,902-user registry achieved the ≥70% consensus target. Consistent bolusing matters as much as target setting: users with ≥4 boluses per day achieved 72.4% TIR vs 59.9% for those with fewer.
The IOB story: at the most responsive target, the physiological IOB gap is structurally similar to the 780G at AIT 2h. The fact that AIT is internally managed rather than user-set does not reduce the gap, it makes it less visible. Activity mode should be started 90 minutes before exercise.
Does switching to ultra-rapid insulin change the trade-off?
Ultra-rapid insulin formulations (Lyumjev and Fiasp) absorb faster and clear sooner than standard rapid-acting analogues. In controlled studies, Lyumjev shows approximately 5 minutes faster onset, 8 times greater early exposure in the first 15 minutes, and 35% less late insulin action beyond 4 hours compared with Humalog (Leohr et al. 2021, pooled analysis of 190 participants across four randomised controlled trials).
The question is whether this translates to better outcomes inside an AID system. The evidence says barely. The largest pooled analysis to date (Rakab et al. 2025, systematic review and meta-analysis of 12 randomised controlled trials across six AID systems) found that ultra-rapid insulin produced less than 1 percentage point improvement in time in range compared with standard rapid-acting insulin (mean difference +0.87%, p=0.12, not statistically significant). The AID algorithm compensates for insulin speed so effectively that the formulation barely changes overall glycaemic control. The algorithm is the dominant force; the insulin is one input among many.
Where ultra-rapid insulin does help
The benefit is more subtle than the headline TIR number suggests:
- Glycaemic variability reduced. Coefficient of variation improved by 0.78 percentage points (p=0.02). Fewer sharp spikes, fewer sharp drops.
- Hypoglycaemia reduced. Time below 3.9 mmol/L (70 mg/dL) was lower with ultra-rapid insulin across the pooled analysis.
- Exercise safety improved. Leohr et al. 2026 found that Lyumjev attenuated the glucose drop during exercise and reduced post-exercise meal glucose excursions compared with Humalog, without increasing hypoglycaemia. Free insulin lispro concentrations rose in the first 15 minutes of exercise with both formulations, confirming that exercise accelerates absorption regardless of insulin type.
One notable caution: nighttime
The Rakab meta-analysis found that nighttime TIR actually worsened by 1.9 percentage points (p=0.0001) with ultra-rapid insulin. Faster clearance may leave less residual overnight basal coverage. This is a nuanced finding that challenges any blanket recommendation to switch. Switching is worth considering for variability reduction and exercise safety margins, not for overall TIR improvement; discuss with your diabetes care team whether the trade-offs are right for your situation.
Evidence: Rakab et al. 2025, Frontiers in Endocrinology (systematic review and meta-analysis of 12 RCTs); Leohr et al. 2021, Clinical Pharmacokinetics (pooled PK/PD analysis, N=190); Leohr et al. 2026, Diabetes Care (exercise PK comparison); Pinsker et al. 2024, Diabetes Technology and Therapeutics (URLi in Control-IQ, n=179, 14 centres); Grosman et al. 2021, Computer Methods and Programs in Biomedicine (Fiasp vs NovoLog in 670G simulation, 7,485 virtual patients).
Exercise: where the trade-off becomes urgent
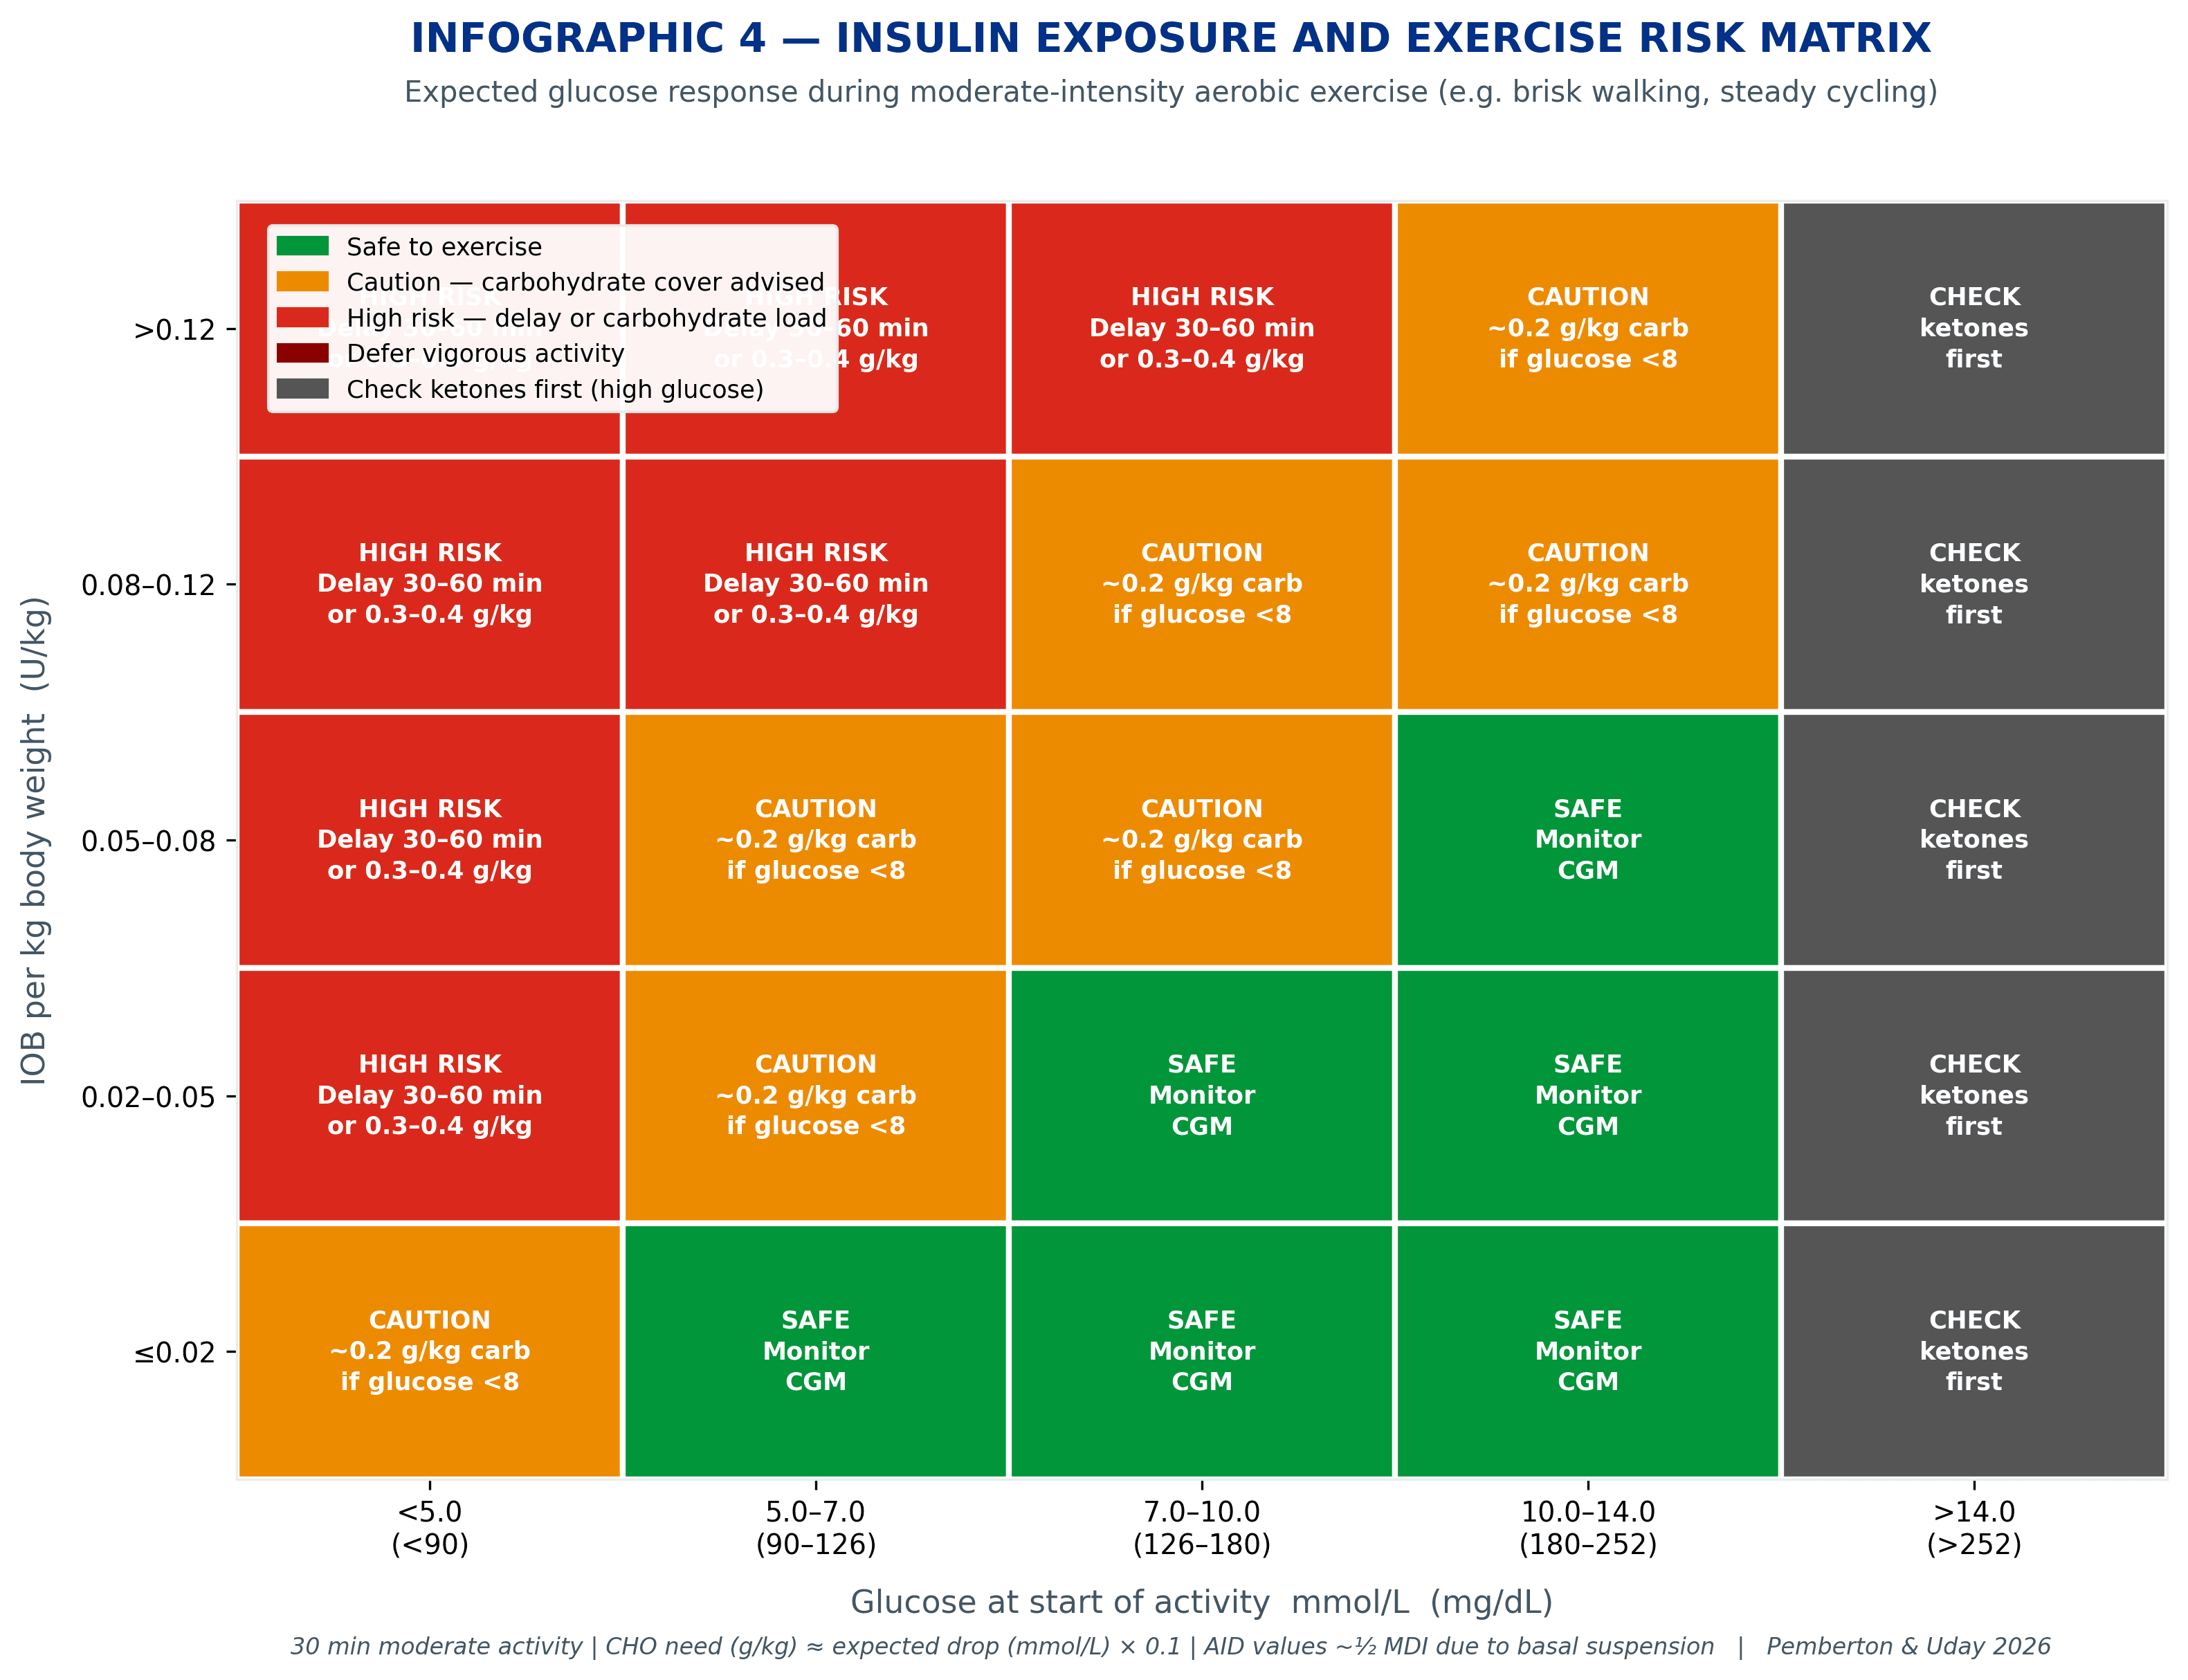
Exercise is where the IOB trade-off becomes visible, and sometimes urgently so. During aerobic activity, insulin action is amplified through muscle glucose uptake pathways that are partly independent of insulin. The algorithm responds by reducing basal delivery, but it can only reduce what it is currently delivering. It cannot recall insulin that has already been absorbed.
The glucose-lowering effect of activity is directly proportional to how much physiological insulin is circulating. A glucose of 8.0 mmol/L with low IOB is a different pre-exercise state from the same glucose with high IOB.
After exercise: reducing insulin vs adding carbohydrate
Both strategies work for the same total time-in-range outcome (Tagougui et al. 2026 RCT). The practical difference: insulin reduction delays the first hypoglycaemic event by nearly an hour (140 vs 83 minutes), which matters most for afternoon and evening exercise when overnight low risk is highest.
The 20-by-2 rule
20 minutes of moderate-intensity activity produces a glucose reduction of approximately 2 mmol/L (35 mg/dL) when physiological IOB is low to moderate. This principle, featured in the GNL Activity to Lower Highs Explorer, makes activity a non-insulin route to glucose reduction. At high IOB (>0.10 U/kg), the same 20 minutes can produce considerably larger drops with continued decline after stopping.
AID users and exercise carbohydrate: approximately half of MDI guidelines
AID algorithms detect falling glucose during exercise and progressively suspend basal delivery. This algorithm-driven basal suppression reduces effective circulating insulin by approximately 30 to 50% compared with multiple daily injection (MDI) therapy under the same exercise conditions. As a result, carbohydrate requirements for AID users are approximately half those recommended for people on MDI for the same activity type, duration, and intensity, consistent with ISPAD 2022 (Adolfsson et al.) and the EASD/ISPAD 2025 position statement on AID and physical activity.
Standard exercise carbohydrate tables designed for MDI will substantially overestimate the carbohydrate most AID users need. The Exercise IOB Explorer uses AID-specific estimates based on IOB, activity type, and duration.
The four-hour heuristic, for all systems
“Have I given a bolus for food in the last four hours?” If yes, there is physiologically circulating insulin, regardless of what any IOB display shows. Time elapsed since the last meal bolus is the most reliable exercise safety signal when using AID systems at high responsiveness settings. The EASD/ISPAD position statement notes that IOB on AID systems does not accurately reflect peak insulin action, which typically occurs 1 to 2 hours after the prandial bolus dose.
Settings are levers, not prescriptions
Each system gives clinicians and people with diabetes different levers to pull. Tap a system to expand the lever map.
Control-IQ
Primary lever: correction factor (CF). IOB model: fixed 5 hours, the most transparent of the four; conservative, rarely underestimates. Correction frequency: hourly when predicted >10.0 mmol/L within 30 minutes. Exercise: four-hour heuristic; watch for negative IOB.
MiniMed 780G
Primary lever: AIT (2 to 3h user-set) + glucose target. IOB model: 0% display at 2h while approximately 40 to 45% remains physiologically active. Correction frequency: every 5 minutes. Exercise: four-hour heuristic critical; Bassi 2025 confirms AIT 2h is safe at the lowest target.
CamAPS FX
Primary lever: target glucose + carb ratio (ICR). IOB model: bolus IOB only is displayed; algorithmic delivery is invisible to the IOB screen. Correction frequency: continuous adaptive. Exercise: Ease Off 90 minutes before; rotate to landscape view for the full delivery history.
Omnipod 5
Primary lever: glucose target (drives internal AIT 2 to 4h). IOB model: AIT internally managed; the gap at the lowest target is structurally similar to 780G at AIT 2h. Correction frequency: continuous adaptive. Exercise: Activity mode 90 minutes before; four-hour heuristic.
The AID Algorithm Optimiser lets you enter age, weight, and total daily dose, then see exactly how each system responds at five responsiveness levels.
A note on CGM metrics and HbA1c
When using time in range (TIR) to guide AID configuration decisions, be aware that HbA1c and TIR can give different signals for the same person. Pemberton, Uday, Krone, Fang and Chalew 2025 (BMJ Open Diabetes Research and Care) showed in a Birmingham UK paediatric T1D cohort (n=168) that Black children and young people have approximately 4 mmol/mol higher adjusted HbA1c than White and South Asian peers at the same mean glucose, independent of CGM use, insulin delivery, and deprivation. Escalating AID settings based on HbA1c alone when TIR is already adequate risks delivering excess insulin without glycaemic benefit. The personalised matrix in the What Gets Measured Gets Managed guide formalises this with TBR ceilings on every cell.
Use CGM metrics, TIR, time below range, coefficient of variation, as the primary measure of glycaemic control when optimising AID settings. If HbA1c and TIR appear discordant, explore this with your diabetes care team before changing settings.
No clinician can do this maths in their head
This is the uncomfortable truth behind AID optimisation. The interactions between IOB decay curves, correction factors, basal modulation, meal absorption, and activity are too complex for mental arithmetic. A 15-minute clinic appointment cannot model how a correction factor change on Control-IQ will alter the stacking risk compared to shortening AIT on the 780G.
This is not a criticism of clinical practice, it is a recognition that the systems themselves are more sophisticated than the tools traditionally available to discuss them. The algorithms run continuous calculations every five minutes. The conversations about them happen every three months. This is exactly why the GNL Explorers exist; they let clinicians and people with diabetes see, visually and numerically, what changing a setting actually does to the system’s behaviour.
When a young person asks “Why does my pump keep giving me corrections at night?” the answer is different on every system. On Control-IQ, it may be a basal profile issue. On the 780G, it may be the AIT setting. On CamAPS, it may be the overnight target. Without a tool that shows these differences, the conversation defaults to generic advice. With the explorers, it can become specific.
Explore the differences yourself
Two GNL Explorers are built around this article’s central question. The AID Algorithm Optimiser puts each system’s responsiveness levels side by side. The Exercise IOB Explorer translates physiological insulin exposure into AID-specific carbohydrate estimates.
AID Algorithm Optimiser
Enter age, weight, and total daily dose. See how all four systems behave at five responsiveness levels.
Exercise IOB Explorer
Carbohydrate estimates for activity based on physiological IOB and body weight, using AID-specific values.
The bottom line
AID systems are remarkable. They have changed what is achievable for hundreds of thousands of people with type 1 diabetes. But they are not identical, and treating them as interchangeable misses the point.
The IOB trade-off, the design choice each system makes about how to track active insulin, shapes everything downstream. It determines how responsively the algorithm corrects, how visible the remaining insulin is to the person, and how safe it is to start exercising after a meal bolus. Real-world data from more than 190,000 users confirms that the gap between those who understand and apply these principles and those who do not is 10 to 15 percentage points in time in range.
That gap is closeable. The evidence is there. The tools exist. The conversation just needs the right framework.
This content is for educational exploration only. It is based on clinical data and real-world patterns describing average responses across populations. It is not a prescription, not a medical device, and must not be used as either. It cannot replace individual clinical guidance from your diabetes care team. Read the full GNL disclaimer.
For the full reference list, ask Grace or see The IOB Guide, Part 7: Recommended Reading and Resources.